- India
- International
Friday, Apr 19, 2024
Journalism of Courage
 The fall in the IIP number is in line with the contraction in the August core sector, as reflected in data released earlier this month by the industry department.
According to the data for the “Quick Estimates of Index of Industrial Production” released by the Ministry of Statistics and Programme Implementation (MoSPI) on Friday, India’s industrial sector production contracted by 1.1 per cent in August when compared to the production in the same month in 2018.
As far as such year-on-year comparisons go, the last time a reduction in the IIP happened was in June 2017. But this time, the fall was sharper — the index has fallen to an 81-month low, leading back to November 2012.
As the name suggests, the Index of Industrial Production (IIP) maps the change in the volume of production in Indian industries. More formally, it chooses a basket of industrial products — ranging from the manufacturing sector to mining to energy, creates an index by giving different weight to each sector and then tracks the production every month. Finally, the index value is compared to the value it had in the same month last year to figure out the economy’s industrial health.
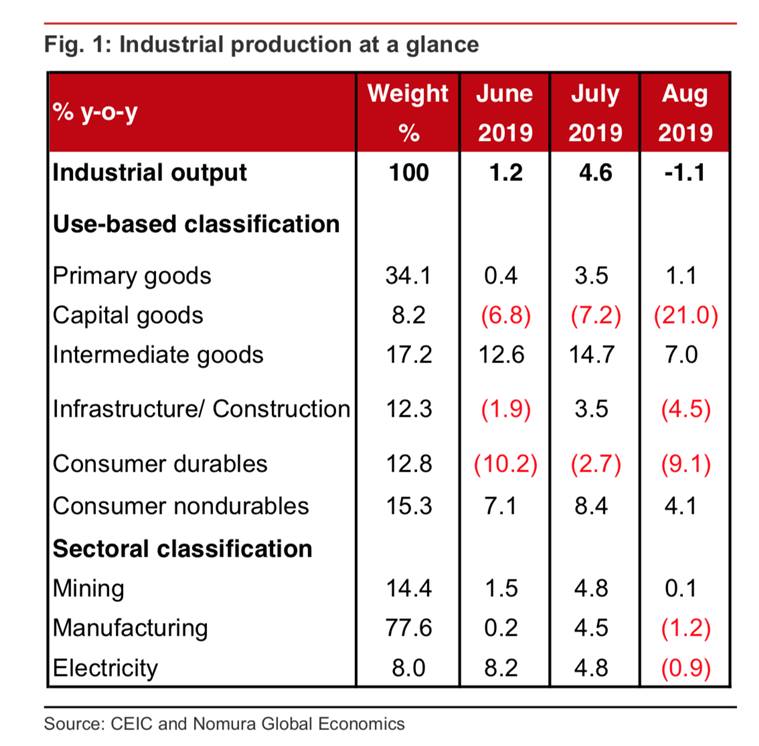
There are two ways in which IIP data can be viewed. The first is to look at sectoral performance. In this the whole industrial economy is divided into three sectors; the first is manufacturing with a weight of 77.6 per cent in the index, the second is mining with a weight of 14.4 per cent and third is electricity with a weight of 8 per cent.
The second way to look at the same production is to look at the way such industrial products are used; this is called the use-based classification.

Table 1 gives the data on both the type of classification.
From a sectoral point of view, it can be seen how the growth rate in the manufacturing production, which has the biggest weight in the index, has been negative — that is, it shrank by 1.2 per cent. In fact, 15 out of the 23 sub-groups in the manufacturing sector showed negative growth in August 2019. The worst were motor vehicles, trailers and semi-trailers, where production declined by over 23 per cent, and machinery and equipment, where production fell by close to 22 per cent.
Electricity production, too, shrank while mining production barely managed to be what it was in August 2018.
If one looks at the use-based classification in the same table, one can see the sustained shrinkage in two key groups — capital goods and consumer durables. This contraction is at the heart of what is wrong with the Indian economy at present. The decline in the production of capital goods, which is the machinery used to produce other goods, shows that there is little desire/demand in the market to invest in existing or new capacity. The decline in consumer durables such a refrigerator or a car shows that existing inventories are not yet being cleared because consumers continue to avoid buying these products.
IIP figures are monthly data and as such it keeps going up and down. In fact, the release calls them “quick estimates” because they tend to get revised after a month or two. As such, it is true that one should not take just one month’s IIP data and project it for the whole year or indeed use it to conclude that the full year’s economic growth will be low.
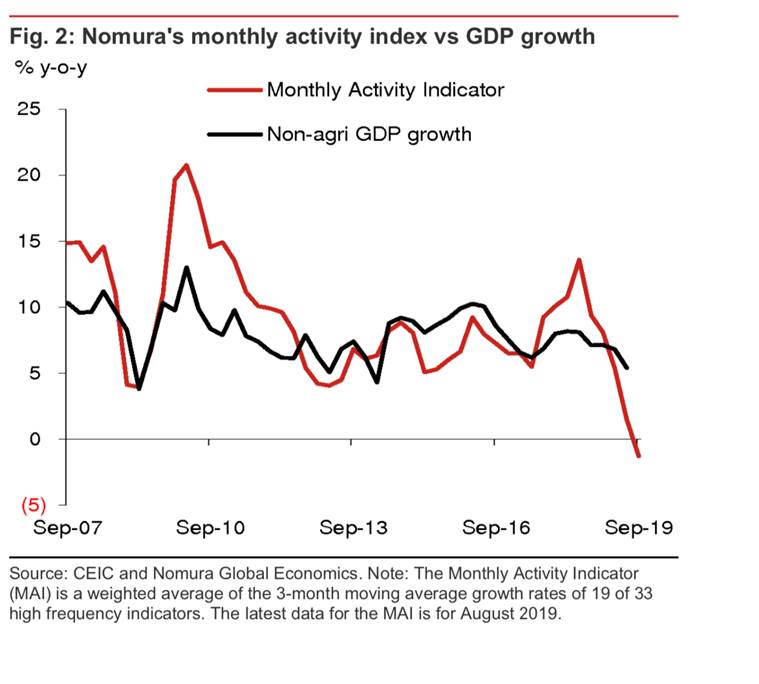
However, as brought out in Table 1, some key sectors are showing sustained weakness within IIP. Moreover, even though it is a lead indicator of overall economic growth, IIP is just one of the markers.
But Figure 2 from Nomura’s Monthly Activity Index (MAI) — a weighted average of 19 high-frequency indicators — tends to map the overall (non-agricultural) economic growth pretty closely. As such, a dip in IIP, especially the sustained weakness in manufacturing industries, does not bode well for India’s economic growth in the near term.

Is there hope for India’s dying wastelands?Subscriber Only

The momo story: How Dolma Aunty fought for her brandSubscriber Only

Mehsampur: An angrier alternative to Imtiaz Ali's ChamkilaSubscriber Only


UPMSP UP Board will announce Class 12 and 10 results on April 20 at 2 pm. Students can access their scores on the official website using their registration number/roll number and password. Last year, the pass percentage was 75.52%, with girls scoring 83% and boys scoring 69.34%. Despite reports of paper leaks, the board conducted exams for over 25 lakh students.