Update: For easy bandwidth visualization from packet captures, check out a web-based pcap parser we wrote: https://medium.com/cybersift/the-cybersift-packet-capture-parser-bandwidth-usage-43fe479ecaf0
There are of course several ways of measuring bandwidth usage from a particular PC. But when it comes to granularity and detail, almost nothing beats wireshark.
Wireshark has several ways of showing the bandwidth being used, each method displays the information with different granularity / clarity. In this quick article we explore three different ways of measuring the bandwidth
The test is quite easy to replicate:
1. Open a web-browser and navigate to a site from where you can download large iso images. Of course, this will test HTTP bandwidth, but since wireshark can sniff any protocol, you can use anything you want for testing.
2. Start a packet capture (preferably without capture filters, just in case we miss some traffic) and start the download (or the service you are testing)
In my case I started downloading the ubuntu image from their website, in the background leaving wireshark running. Once the download completes, get back to wireshark.
3. Apply display filters in wireshark to display only the traffic you are interested in. Its usually quite simple. Once you identify a packet belonging to the network flow you are interested in, right click on it > conversation filter > ip / tcp. This will isolate the IP / TCP traffic of interest
The first method of seeing bandwidth used is by selecting the menu items: Statistics > Protocol Hierarchy
This screen will give you a breakdown of bandwidth by protocol. Since in this test we are observing HTTP, we drill down to TCP, and we observe the Mbits/sec, which is about 1.6 in this case:
Also note the display filter, which means the statistics apply only to this TCP stream. You may of course apply more granular display filters for almost limitless possibilities of display.
The second method is by using Statistics > Summary
Again we see the display filter, and the bandwidth used. Also note the slight discrepancy between the bandwidth used in the captured packets and that in the displayed packets…. since it’s average speed, when applying a display filter, the number of packets decreases, so we get a less accurate calculation of bandwidth.
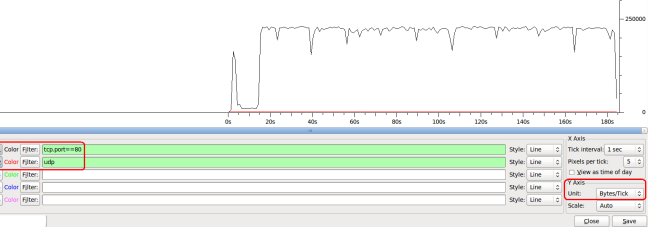
The last method produces a nice graph. Go to statistics > IO graphs:
Couple of things to point out:
1. You may set multiple filters and display them simultaneously. Useful if you want to compare two IPs for example. Remember to press the “graph” button near each filter! For example, here I have both the HTTP transfer and UDP traffic showing.
2. Change the Y-Axis to bytes/tick, and leave the X-axis tick to 1 sec. This will give you the bytes/sec.


Thanks for the detailed explaination of measuring bandwidth using Wireshark. This will come in handy when I complete a Wireshark lab in a few weeks.
Thank you, it’s very interesting.
Thanks!…Made a better wireshark user.