Markets
The Origin of the Greek Crisis
For a larger version of this infographic, click here.
The Origin of the Greek Crisis
For a larger version of this infographic, click here.
In past charts and infographics, we’ve broken down parts of the Greek crisis with a focus on particular issues. For example, the exodus in population or a breakdown of Greece’s debt by creditor.
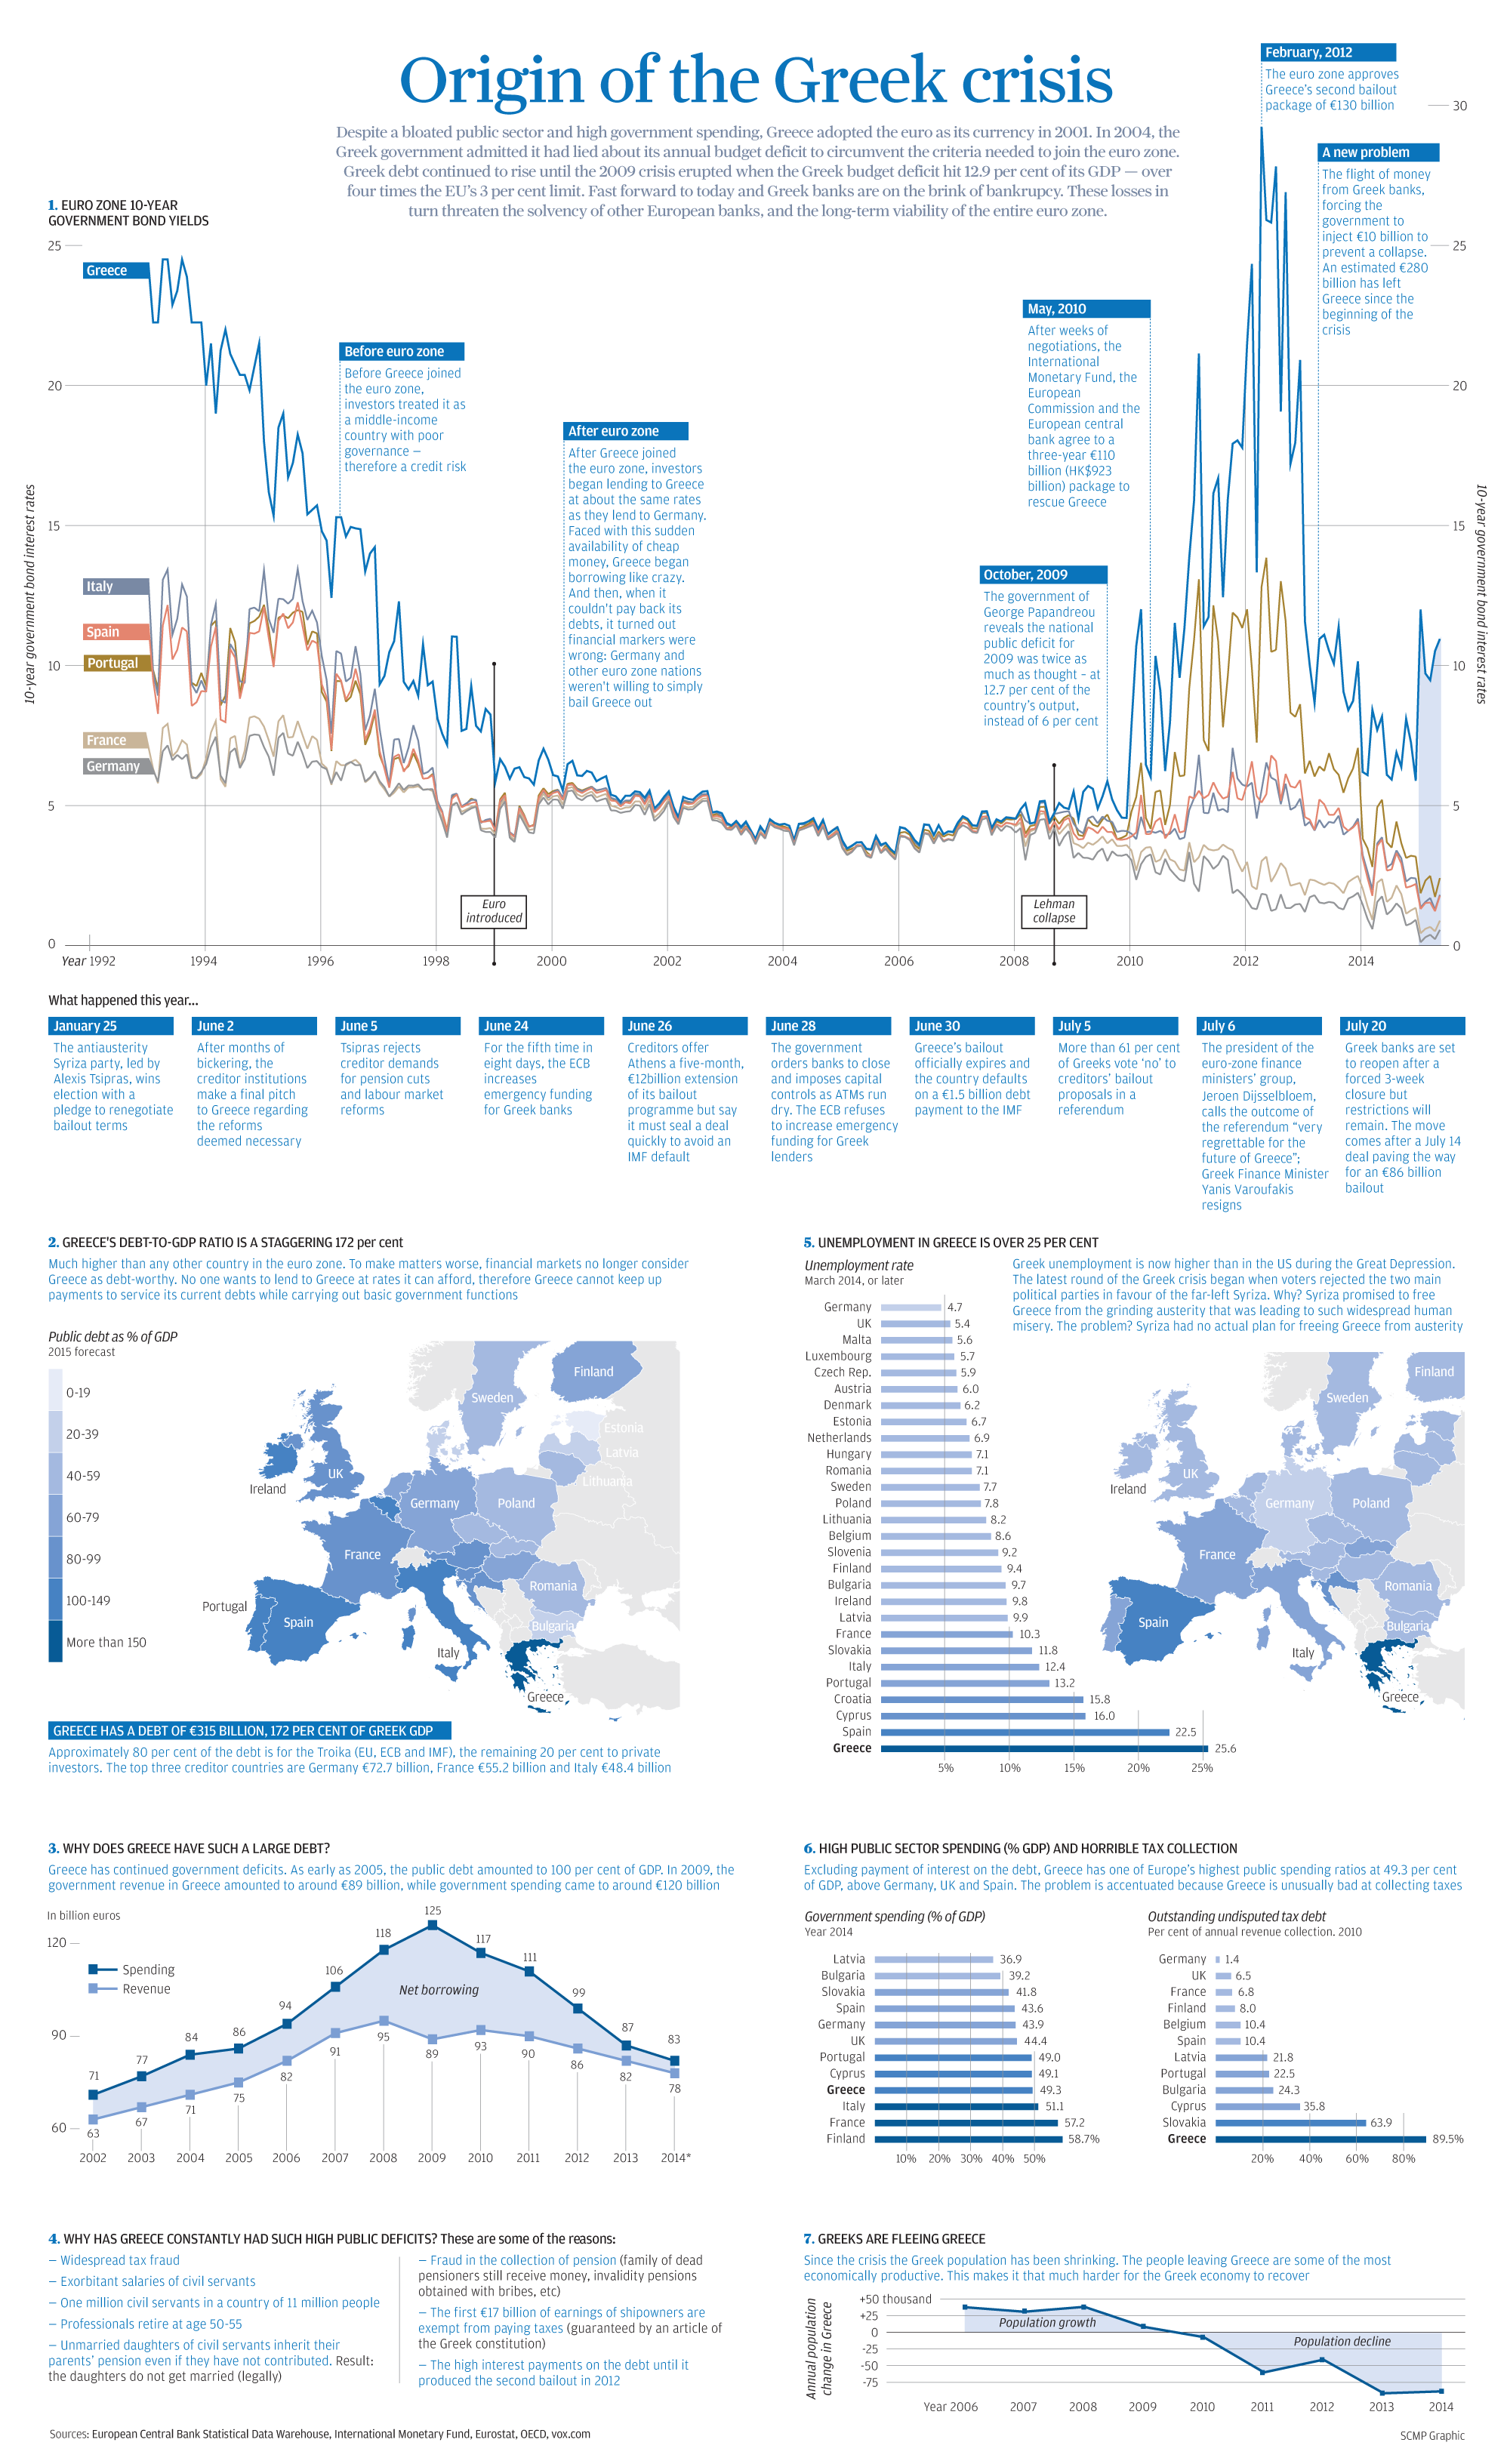
However, today’s infographic puts everything all in one place and recaps the full story from start to near-finish. There is a thorough timeline that shows the events that have led to today in chronological order. The infographic also charts various struggles, ranging from the country’s failure in collecting taxes to the exponential increase in net borrowing after the Lehman collapse.
Here’s a quick recap of the most salient facts in the infographic:
- In 1994, the Greek 10-yr bond yield was just short of 25%. With plans to join the monetary union, the Greek yield got whittled down over the next five years to converge with the rest of the euro zone at closer to 6%.
- From 1999 until the Lehman collapse in 2008, Greek bonds traded at par with all other euro zone countries. For almost a decade, investors pegged Greece as having the same amount of risk as Germany or France.
- The European Debt Crisis begins and bond yields decouple. Greece’s yield skyrockets to closer to 30% in 2012 before the second bailout is approved by the euro zone.
- Greece’s public sector debt is now at 172%, which is far higher than any other country in the euro zone. We’ve broken down this debt by creditor here.
- Greek unemployment is higher than in the United States during the Great Depression. Compare Greece’s 25.6% unemployment rate to that of other semi-troubled countries such as Portugal (13.2%) or Italy (12.4%).
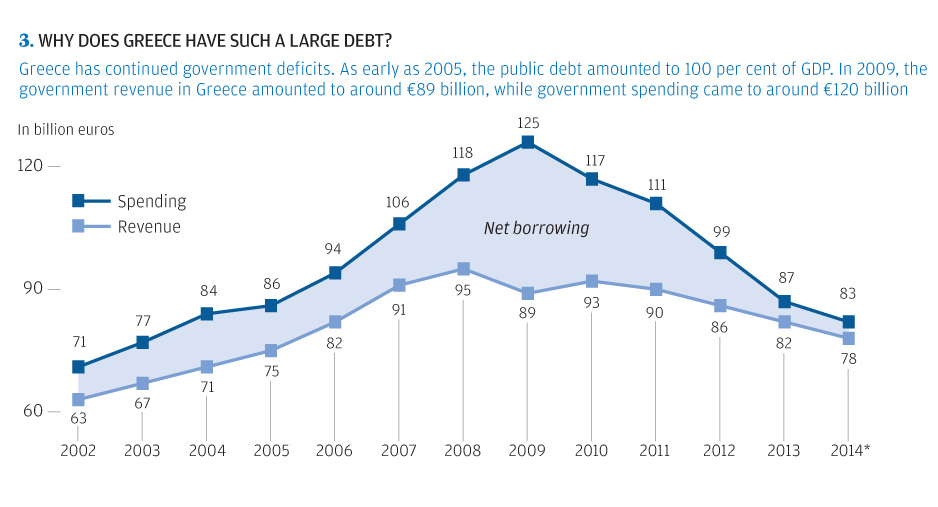
- Greece’s spending increased dramatically over the years from €71 billion (2002) to €125 billion (2009). The only problem? Revenues peaked at only €95 billion in 2008.
- The difference between spending and revenue is Greece’s net borrowing. The biggest deficit run was in 2009 when revenue was €89 billion and spending was €125 billion. That’s a difference of €36 billion when Greece’s GDP was only €237 billion at the time.
- Greece’s government spending is not the highest in relation to its GDP. At 49.3%, it trails Italy (51.1%), France (57.2%), and Finland (58.7%).
- However, Greece’s tax collection is the worst, which severely impairs revenue. In 2010, an astounding 89.5% of annual revenue collection was outstanding undisputed tax debt.
- Greeks are fleeing the country. Since the crisis the population has been shrinking dramatically. As we noted in our Greek exodus chart, the population decreased by nearly 100,000 people in both 2013 and 2014. Bank deposit flows have also been negative for the most part since 2009 as well.
Original graphic by: SCMP


Maps
Mapped: The 10 U.S. States With the Lowest Real GDP Growth
In this graphic, we show where real GDP lagged the most across America in 2023 as high interest rates weighed on state economies.


The Top 10 U.S. States, by Lowest Real GDP Growth
This was originally posted on our Voronoi app. Download the app for free on iOS or Android and discover incredible data-driven charts from a variety of trusted sources.
While the U.S. economy defied expectations in 2023, posting 2.5% in real GDP growth, several states lagged behind.
Last year, oil-producing states led the pack in terms of real GDP growth across America, while the lowest growth was seen in states that were more sensitive to the impact of high interest rates, particularly due to slowdowns in the manufacturing and finance sectors.
This graphic shows the 10 states with the least robust real GDP growth in 2023, based on data from the Bureau of Economic Analysis.
Weakest State Economies in 2023
Below, we show the states with the slowest economic activity in inflation-adjusted terms, using chained 2017 dollars:
| Rank | State | Real GDP Growth 2023 YoY | Real GDP 2023 |
|---|---|---|---|
| 1 | Delaware | -1.2% | $74B |
| 2 | Wisconsin | +0.2% | $337B |
| 3 | New York | +0.7% | $1.8T |
| 4 | Missississippi | +0.7% | $115B |
| 5 | Georgia | +0.8% | $661B |
| 6 | Minnesota | +1.2% | $384B |
| 7 | New Hampshire | +1.2% | $91B |
| 8 | Ohio | +1.2% | $698B |
| 9 | Iowa | +1.3% | $200B |
| 10 | Illinois | +1.3% | $876B |
| U.S. | +2.5% | $22.4T |
Delaware witnessed the slowest growth in the country, with real GDP growth of -1.2% over the year as a sluggish finance and insurance sector dampened the state’s economy.
Like Delaware, the Midwestern state of Wisconsin also experienced declines across the finance and insurance sector, in addition to steep drops in the agriculture and manufacturing industries.
America’s third-biggest economy, New York, grew just 0.7% in 2023, falling far below the U.S. average. High interest rates took a toll on key sectors, with notable slowdowns in the construction and manufacturing sectors. In addition, falling home prices and a weaker job market contributed to slower economic growth.
Meanwhile, Georgia experienced the fifth-lowest real GDP growth rate. In March 2024, Rivian paused plans to build a $5 billion EV factory in Georgia, which was set to be one of the biggest economic development initiatives in the state in history.
These delays are likely to exacerbate setbacks for the state, however, both Kia and Hyundai have made significant investments in the EV industry, which could help boost Georgia’s manufacturing sector looking ahead.

-

 United States1 week ago
Mapped: Countries Where Recreational Cannabis is Legal
-

 Healthcare2 weeks ago
Life Expectancy by Region (1950-2050F)
-

 Markets2 weeks ago
The Growth of a $1,000 Equity Investment, by Stock Market
-

 Markets2 weeks ago
Mapped: Europe’s GDP Per Capita, by Country
-

 Money2 weeks ago
Charted: What Frustrates Americans About the Tax System
-

 Technology2 weeks ago
Countries With the Highest Rates of Crypto Ownership
-

 Mining2 weeks ago
Where the World’s Aluminum is Smelted, by Country
-

 Personal Finance2 weeks ago
Visualizing the Tax Burden of Every U.S. State