Markets
Mapped: Foreign Direct Investment by Country
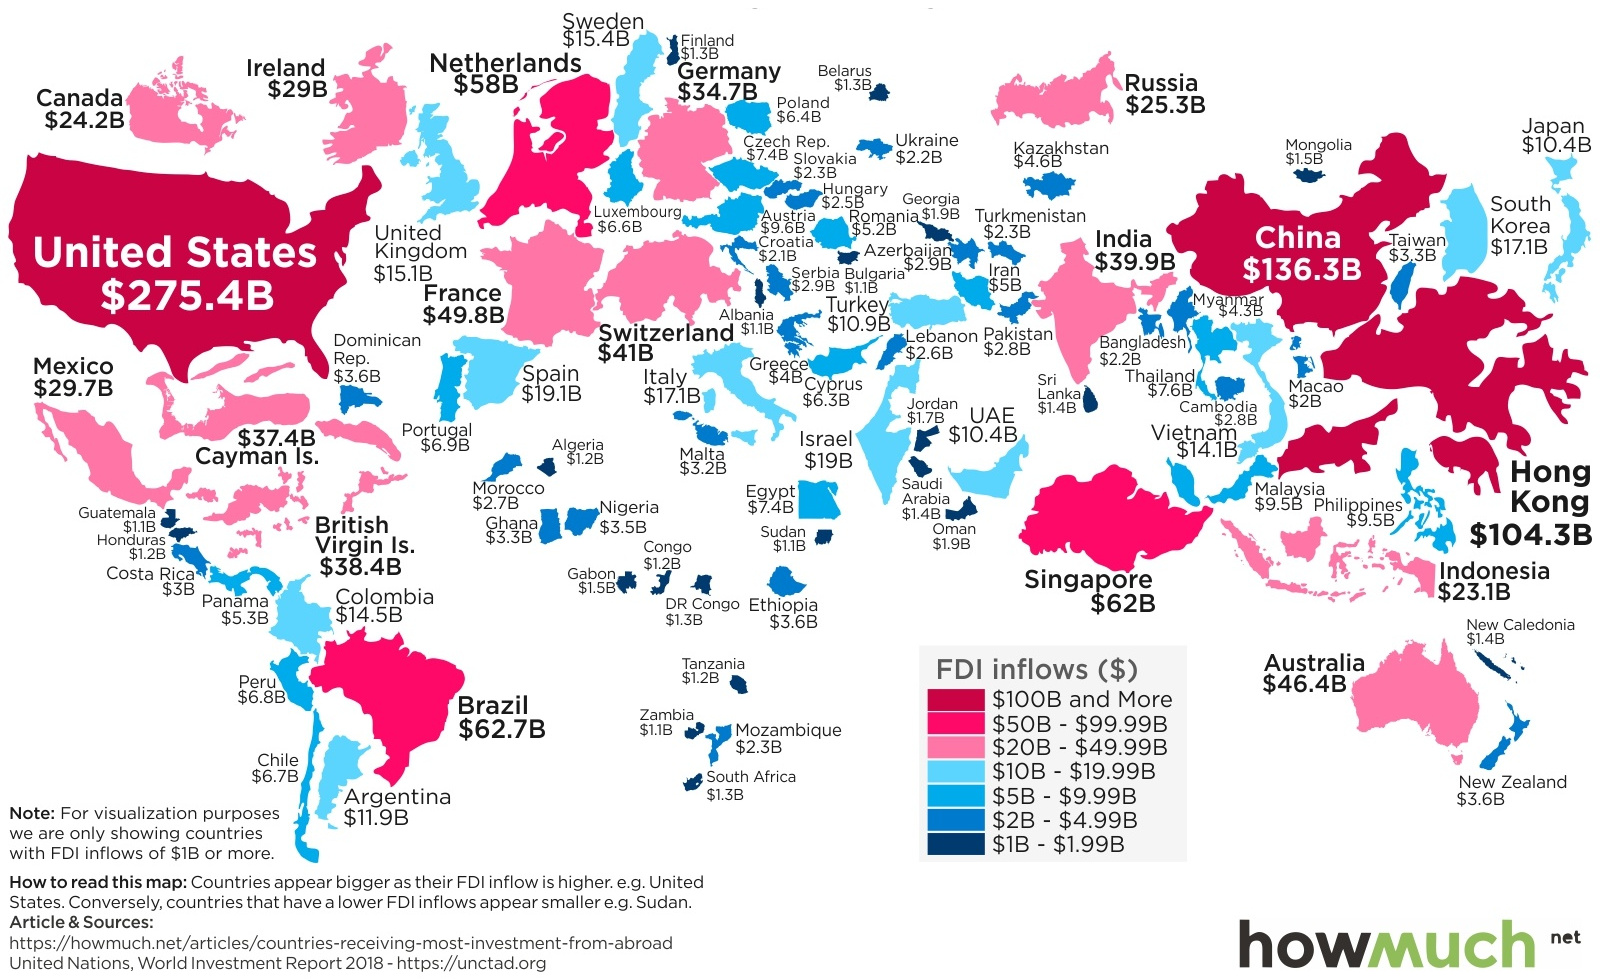
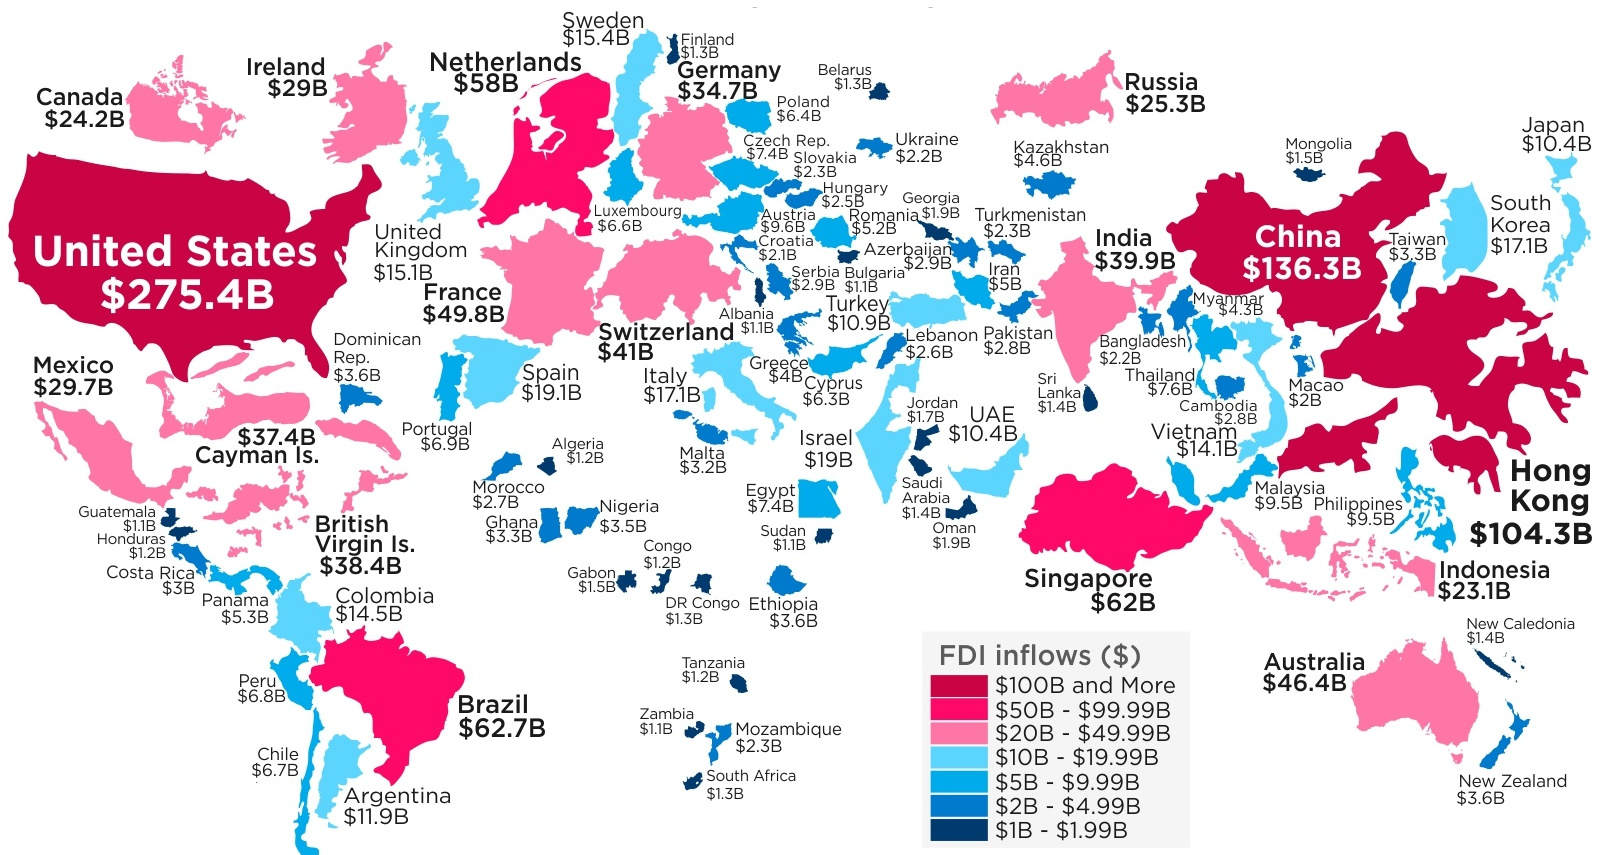
Map: Foreign Direct Investment by Country
For many of the world’s companies, the best investment opportunities aren’t always located within their own domestic borders.
Whether it is building a new Starbucks store in Abu Dhabi or Tata Motors acquiring Land Rover, foreign direct investment (FDI) is a measure of how much business capital is flowing in and out of countries.
In 2017, total foreign direct investment was $1.43 trillion globally, and today’s map from HowMuch.net breaks down where this money went by country.
The Countries Getting FDI
The following data comes from a recent report by the United Nations Conference on Trade and Development.
At a high level, here is where foreign direct investment flows went, based on the type of economy:
| FDI Inflows | FDI Outflows | |
|---|---|---|
| Developed economies | $712.4 billion | $1,009.2 billion |
| Developing economies | $670.7 billion | $380.8 billion |
Most money flows out of wealthier countries, and it flows into both developed and developing nations.
Foreign direct investment is often considered a win-win that brings new capital and jobs to developing nations, while simultaneously creating opportunities for corporations and investors.
Now, let’s look at the top 15 countries and jurisdictions receiving FDI inflows:
| Rank | Jurisdiction | FDI Inflows |
|---|---|---|
| #1 | United States | $275.4 billion |
| #2 | China | $136.3 billion |
| #3 | Hong Kong (SAR) | $104.3 billion |
| #4 | Brazil | $62.7 billion |
| #5 | Singapore | $62.0 billion |
| #6 | Netherlands | $58.0 billion |
| #7 | France | $49.8 billion |
| #8 | Australia | $46.4 billion |
| #9 | Switzerland | $41.0 billion |
| #10 | India | $39.9 billion |
| #11 | British Virgin Islands | $38.4 billion |
| #12 | Cayman Islands | $37.4 billion |
| #13 | Germany | $34.7 billion |
| #14 | Mexico | $29.7 billion |
| #15 | Ireland | $29.0 billion |
At the top of the list are the United States ($275.4 billion) as well as China and Hong Kong ($240.6 billion), which is not surprising to see.
Further down the list, things become more interesting. Tax havens such as the British Virgin Islands and the Cayman Islands rank higher than developed economies like Canada, United Kingdom, and Japan, which don’t even come close to cracking the top 15.
Meanwhile, Brazil’s ranking in fourth place is also quite impressive with $62.7 billion of foreign direct investment inflows in 2017 – this is not a one-time thing either, since the economy had $58 billion of inflows in 2016 as well.


Maps
Mapped: The 10 U.S. States With the Lowest Real GDP Growth
In this graphic, we show where real GDP lagged the most across America in 2023 as high interest rates weighed on state economies.


The Top 10 U.S. States, by Lowest Real GDP Growth
This was originally posted on our Voronoi app. Download the app for free on iOS or Android and discover incredible data-driven charts from a variety of trusted sources.
While the U.S. economy defied expectations in 2023, posting 2.5% in real GDP growth, several states lagged behind.
Last year, oil-producing states led the pack in terms of real GDP growth across America, while the lowest growth was seen in states that were more sensitive to the impact of high interest rates, particularly due to slowdowns in the manufacturing and finance sectors.
This graphic shows the 10 states with the least robust real GDP growth in 2023, based on data from the Bureau of Economic Analysis.
Weakest State Economies in 2023
Below, we show the states with the slowest economic activity in inflation-adjusted terms, using chained 2017 dollars:
| Rank | State | Real GDP Growth 2023 YoY | Real GDP 2023 |
|---|---|---|---|
| 1 | Delaware | -1.2% | $74B |
| 2 | Wisconsin | +0.2% | $337B |
| 3 | New York | +0.7% | $1.8T |
| 4 | Missississippi | +0.7% | $115B |
| 5 | Georgia | +0.8% | $661B |
| 6 | Minnesota | +1.2% | $384B |
| 7 | New Hampshire | +1.2% | $91B |
| 8 | Ohio | +1.2% | $698B |
| 9 | Iowa | +1.3% | $200B |
| 10 | Illinois | +1.3% | $876B |
| U.S. | +2.5% | $22.4T |
Delaware witnessed the slowest growth in the country, with real GDP growth of -1.2% over the year as a sluggish finance and insurance sector dampened the state’s economy.
Like Delaware, the Midwestern state of Wisconsin also experienced declines across the finance and insurance sector, in addition to steep drops in the agriculture and manufacturing industries.
America’s third-biggest economy, New York, grew just 0.7% in 2023, falling far below the U.S. average. High interest rates took a toll on key sectors, with notable slowdowns in the construction and manufacturing sectors. In addition, falling home prices and a weaker job market contributed to slower economic growth.
Meanwhile, Georgia experienced the fifth-lowest real GDP growth rate. In March 2024, Rivian paused plans to build a $5 billion EV factory in Georgia, which was set to be one of the biggest economic development initiatives in the state in history.
These delays are likely to exacerbate setbacks for the state, however, both Kia and Hyundai have made significant investments in the EV industry, which could help boost Georgia’s manufacturing sector looking ahead.

-

 United States7 days ago
Mapped: Countries Where Recreational Cannabis is Legal
-

 Healthcare2 weeks ago
Life Expectancy by Region (1950-2050F)
-

 Markets2 weeks ago
The Growth of a $1,000 Equity Investment, by Stock Market
-

 Markets2 weeks ago
Mapped: Europe’s GDP Per Capita, by Country
-

 Money2 weeks ago
Charted: What Frustrates Americans About the Tax System
-

 Technology2 weeks ago
Countries With the Highest Rates of Crypto Ownership
-

 Mining2 weeks ago
Where the World’s Aluminum is Smelted, by Country
-

 Personal Finance2 weeks ago
Visualizing the Tax Burden of Every U.S. State