Demographics
Visualizing India’s Population Growth from 2022-2100
Article/Editing:
Visualizing India’s Population Growth from 2022-2100
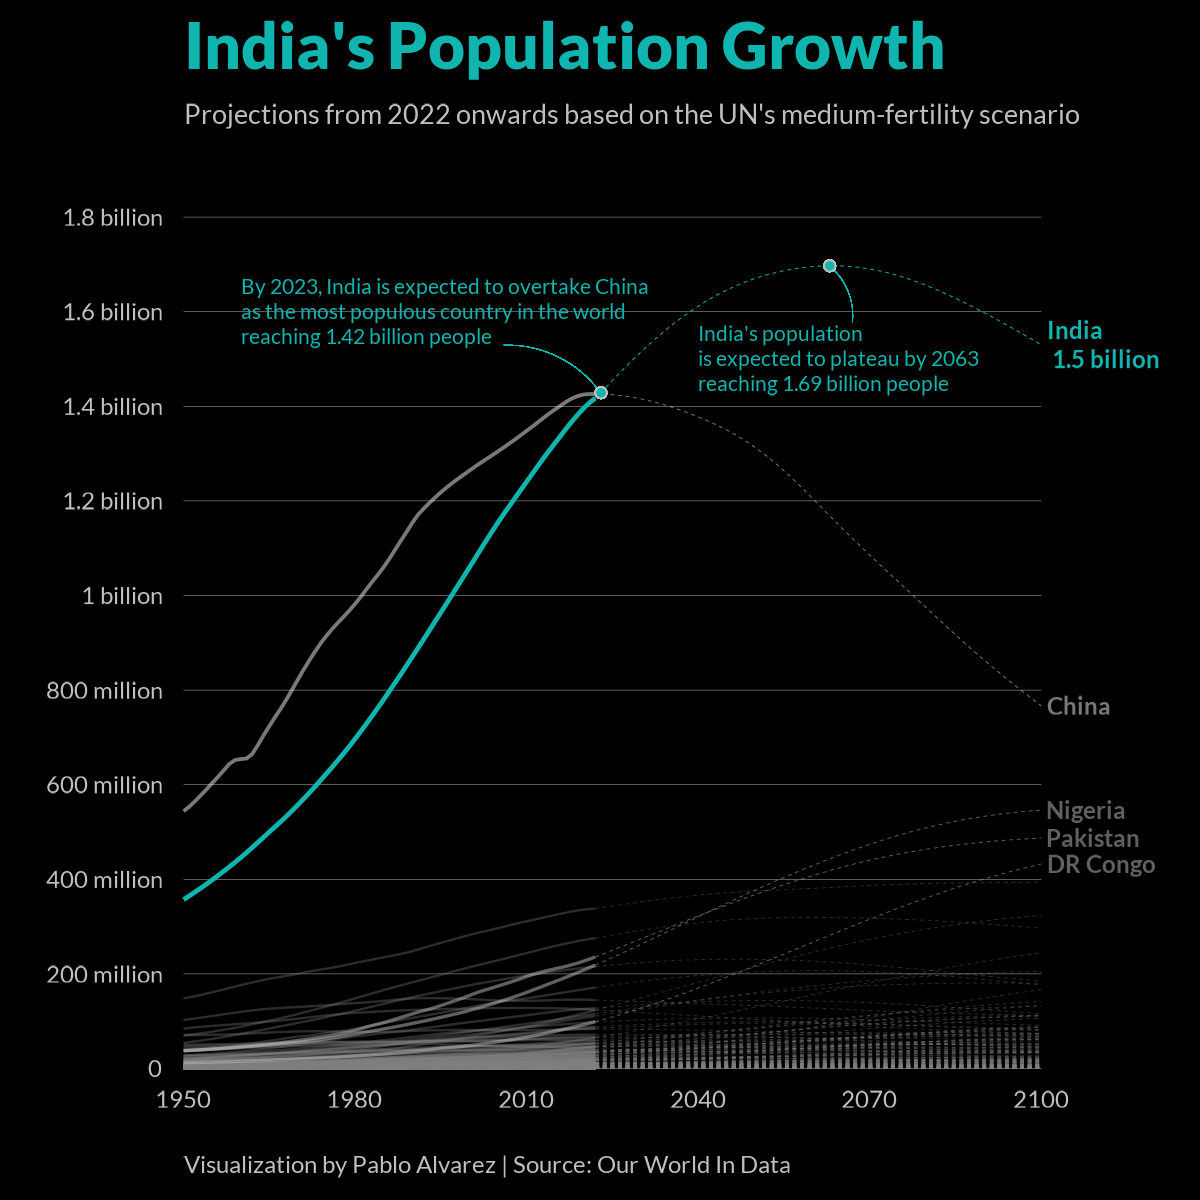
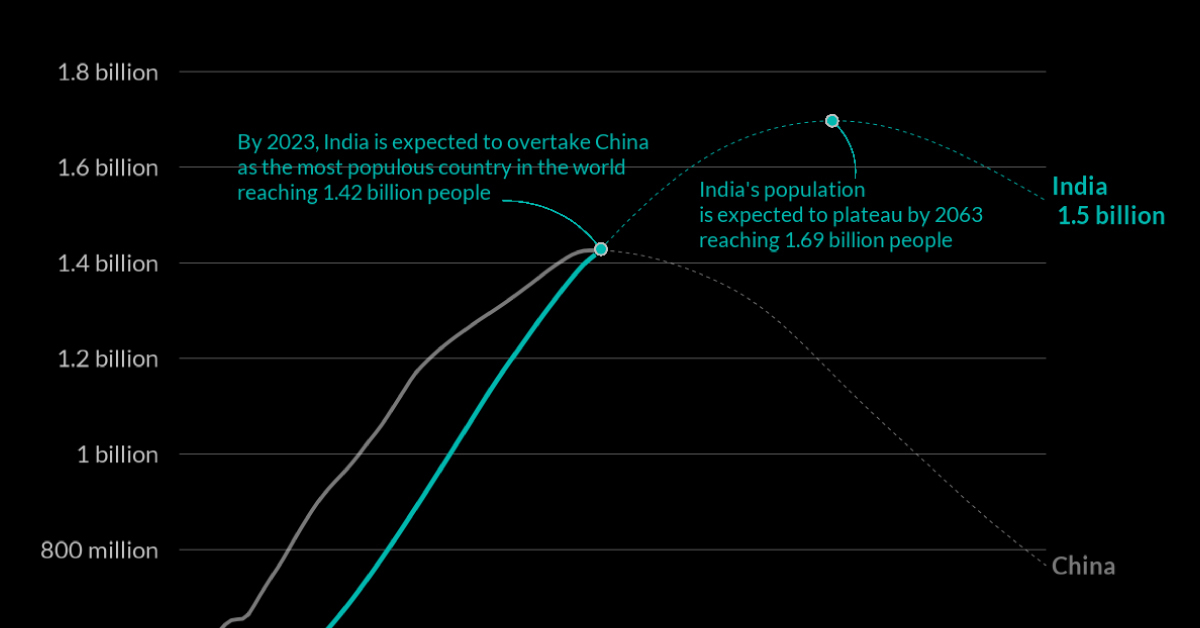
For years, India has been on track to overtake China as the world’s most populated country.
In fact, we’ve covered this phenomenon in past articles, back when India was expected to overtake China’s population by the end of the decade.
However, according to the UN’s latest population prospects, this takeover is projected to happen sooner than previously expected—as early as next year.
This graphic by Pablo Alvarez provides an up-to-date chart of India’s population growth projections compared to other countries. Projection data from Our World in Data ranges from 1800 all the way to until 2100.
Some Historical Context
For over three centuries, China has had the largest population of any country in the world.
In the 1800s, China’s population was about 322 million, which was nearly double India’s at the time. And until the mid-20th century, both countries’ populations stayed relatively stable.
However, in 1949, China’s population started to experience dramatic growth. This occurred after the Chinese Civil War when the People’s Republic of China was first established.
Around the same time, India’s population had also started to increase. Since both countries were experiencing population booms, the status quo remained the same, and China kept its position as the world’s most populated country.
| Year | China's Population | India's Population |
|---|---|---|
| 1950 | 543,979,233 | 357,021,106 |
| 1951 | 553,613,990 | 364,922,356 |
| 1952 | 564,954,522 | 372,997,192 |
| 1953 | 577,378,687 | 381,227,710 |
| 1954 | 589,936,006 | 389,731,408 |
| 1955 | 603,320,152 | 398,577,988 |
| 1956 | 616,283,025 | 407,656,598 |
| 1957 | 630,003,022 | 416,935,404 |
| 1958 | 643,791,575 | 426,295,767 |
| 1959 | 652,179,197 | 435,900,351 |
| 1960 | 654,170,699 | 445,954,573 |
| 1961 | 655,260,384 | 456,351,883 |
| 1962 | 664,614,653 | 467,024,195 |
| 1963 | 683,903,564 | 477,933,620 |
| 1964 | 704,593,776 | 489,059,307 |
| 1965 | 723,846,349 | 500,114,347 |
| 1966 | 742,948,545 | 510,992,615 |
| 1967 | 761,006,267 | 521,987,066 |
| 1968 | 780,371,962 | 533,431,917 |
| 1969 | 801,430,969 | 545,314,679 |
| 1970 | 822,534,453 | 557,501,303 |
| 1971 | 843,285,425 | 569,999,181 |
| 1972 | 862,840,402 | 582,837,969 |
| 1973 | 881,652,084 | 596,107,487 |
| 1974 | 899,367,646 | 609,721,954 |
| 1975 | 915,124,664 | 623,524,225 |
| 1976 | 929,375,929 | 637,451,444 |
| 1977 | 942,581,333 | 651,685,632 |
| 1978 | 955,138,940 | 666,267,761 |
| 1979 | 968,298,969 | 681,248,379 |
| 1980 | 982,372,463 | 696,828,379 |
| 1981 | 997,259,502 | 712,869,300 |
| 1982 | 1,013,483,168 | 729,169,469 |
| 1983 | 1,029,226,907 | 745,826,550 |
| 1984 | 1,044,172,200 | 762,895,161 |
| 1985 | 1,060,239,983 | 780,242,087 |
| 1986 | 1,077,770,524 | 797,878,992 |
| 1987 | 1,096,851,842 | 815,716,128 |
| 1988 | 1,115,889,802 | 833,729,683 |
| 1989 | 1,134,414,721 | 852,012,670 |
| 1990 | 1,153,704,251 | 870,452,162 |
| 1991 | 1,170,626,176 | 888,941,763 |
| 1992 | 1,183,813,393 | 907,574,051 |
| 1993 | 1,195,855,556 | 926,351,289 |
| 1994 | 1,207,286,682 | 945,261,956 |
| 1995 | 1,218,144,429 | 964,279,137 |
| 1996 | 1,228,298,833 | 983,281,216 |
| 1997 | 1,237,801,449 | 1,002,335,231 |
| 1998 | 1,246,836,111 | 1,021,434,572 |
| 1999 | 1,255,433,237 | 1,040,500,049 |
| 2000 | 1,264,099,069 | 1,059,633,672 |
| 2001 | 1,272,739,587 | 1,078,970,908 |
| 2002 | 1,280,926,121 | 1,098,313,030 |
| 2003 | 1,288,873,365 | 1,117,415,122 |
| 2004 | 1,296,816,706 | 1,136,264,583 |
| 2005 | 1,304,887,557 | 1,154,638,717 |
| 2006 | 1,313,086,568 | 1,172,373,788 |
| 2007 | 1,321,513,227 | 1,189,691,814 |
| 2008 | 1,330,167,144 | 1,206,734,803 |
| 2009 | 1,339,125,592 | 1,223,640,160 |
| 2010 | 1,348,191,371 | 1,240,613,616 |
| 2011 | 1,357,095,485 | 1,257,621,190 |
| 2012 | 1,366,560,818 | 1,274,487,221 |
| 2013 | 1,376,100,301 | 1,291,132,067 |
| 2014 | 1,385,189,671 | 1,307,246,508 |
| 2015 | 1,393,715,448 | 1,322,866,506 |
| 2016 | 1,401,889,685 | 1,338,636,336 |
| 2017 | 1,410,275,956 | 1,354,195,684 |
| 2018 | 1,417,069,462 | 1,369,003,309 |
| 2019 | 1,421,864,032 | 1,383,112,049 |
| 2020 | 1,424,929,785 | 1,396,387,128 |
| 2021 | 1,425,893,463 | 1,407,563,841 |
| 2022 | 1,425,887,335 | 1,417,173,176 |
| 2023 | 1,425,671,353 | 1,428,627,666 |
| 2024 | 1,425,178,781 | 1,441,719,857 |
| 2025 | 1,424,381,923 | 1,454,606,728 |
| 2026 | 1,423,255,200 | 1,467,231,220 |
| 2027 | 1,421,809,061 | 1,479,578,524 |
| 2028 | 1,420,045,577 | 1,491,671,044 |
| 2029 | 1,417,974,640 | 1,503,470,599 |
| 2030 | 1,415,605,903 | 1,514,994,087 |
| 2031 | 1,412,946,006 | 1,526,208,895 |
| 2032 | 1,410,012,870 | 1,537,108,031 |
| 2033 | 1,406,810,382 | 1,547,689,840 |
| 2034 | 1,403,314,820 | 1,557,919,804 |
| 2035 | 1,399,547,502 | 1,567,802,259 |
| 2036 | 1,395,546,725 | 1,577,302,810 |
| 2037 | 1,391,338,419 | 1,586,438,626 |
| 2038 | 1,386,952,001 | 1,595,245,784 |
| 2039 | 1,382,367,126 | 1,603,664,860 |
| 2040 | 1,377,556,940 | 1,611,676,335 |
| 2041 | 1,372,522,392 | 1,619,318,358 |
| 2042 | 1,367,267,098 | 1,626,585,371 |
| 2043 | 1,361,737,253 | 1,633,430,527 |
| 2044 | 1,355,912,814 | 1,639,837,776 |
| 2045 | 1,349,756,905 | 1,645,863,188 |
| 2046 | 1,343,210,239 | 1,651,513,758 |
| 2047 | 1,336,262,905 | 1,656,777,044 |
| 2048 | 1,328,873,608 | 1,661,705,661 |
| 2049 | 1,321,004,204 | 1,666,284,988 |
| 2050 | 1,312,636,324 | 1,670,490,601 |
| 2051 | 1,303,756,602 | 1,674,343,637 |
| 2052 | 1,294,381,084 | 1,677,872,878 |
| 2053 | 1,284,539,872 | 1,681,073,177 |
| 2054 | 1,274,244,757 | 1,683,955,037 |
| 2055 | 1,263,512,556 | 1,686,563,352 |
| 2056 | 1,252,371,986 | 1,688,894,376 |
| 2057 | 1,240,879,994 | 1,690,942,710 |
| 2058 | 1,229,126,155 | 1,692,704,326 |
| 2059 | 1,217,157,937 | 1,694,150,262 |
| 2060 | 1,205,020,648 | 1,695,285,494 |
| 2061 | 1,192,805,228 | 1,696,121,515 |
| 2062 | 1,180,553,371 | 1,696,684,918 |
| 2063 | 1,168,316,255 | 1,696,976,688 |
| 2064 | 1,156,145,637 | 1,696,961,377 |
| 2065 | 1,144,050,918 | 1,696,634,190 |
| 2066 | 1,132,053,398 | 1,695,973,643 |
| 2067 | 1,120,182,121 | 1,694,997,001 |
| 2068 | 1,108,424,587 | 1,693,712,645 |
| 2069 | 1,096,787,133 | 1,692,129,035 |
| 2070 | 1,085,287,618 | 1,690,230,784 |
| 2071 | 1,073,902,390 | 1,687,990,288 |
| 2072 | 1,062,612,889 | 1,685,415,098 |
| 2073 | 1,051,380,906 | 1,682,564,511 |
| 2074 | 1,040,194,851 | 1,679,449,249 |
| 2075 | 1,029,035,603 | 1,676,034,859 |
| 2076 | 1,017,860,464 | 1,672,328,378 |
| 2077 | 1,006,663,152 | 1,668,352,088 |
| 2078 | 995,438,014 | 1,664,100,419 |
| 2079 | 984,185,395 | 1,659,592,784 |
| 2080 | 972,906,889 | 1,654,856,929 |
| 2081 | 961,612,987 | 1,649,862,775 |
| 2082 | 950,338,410 | 1,644,678,011 |
| 2083 | 939,100,117 | 1,639,364,769 |
| 2084 | 927,912,383 | 1,633,888,924 |
| 2085 | 916,808,804 | 1,628,242,630 |
| 2086 | 905,821,024 | 1,622,427,549 |
| 2087 | 894,960,259 | 1,616,451,908 |
| 2088 | 884,243,889 | 1,610,366,043 |
| 2089 | 873,694,704 | 1,604,195,815 |
| 2090 | 863,319,537 | 1,597,908,860 |
| 2091 | 853,111,768 | 1,591,484,817 |
| 2092 | 843,067,031 | 1,584,943,122 |
| 2093 | 833,162,187 | 1,578,296,210 |
| 2094 | 823,380,981 | 1,571,569,445 |
| 2095 | 813,718,728 | 1,564,797,337 |
| 2096 | 804,153,592 | 1,557,945,215 |
| 2097 | 794,673,485 | 1,551,000,312 |
| 2098 | 785,270,315 | 1,543,990,233 |
| 2099 | 775,944,429 | 1,536,933,456 |
| 2100 | 766,673,268 | 1,529,850,116 |
China’s baby boom lasted two decades. But by the late 1970s, the Chinese government implemented a one-child policy in an attempt to slow things down and control population growth, out of fear that China was becoming overpopulated.
The plan worked—according to China’s National Health and Family Planning Commission spokesman Mao Qunan, the government’s efforts ended up reducing the number of births over the years by roughly 400 million.
China’s Population is Aging Faster Than India’s
These days, China has one of the most rapidly aging populations in the world. By 2040, it’s expected that 28% of the country’s population will be over the age of 60.
In contrast, India’s population is relatively young—half of its population is under 30, and only an eighth is over 60.
Does this mean that India’s GDP will eventually outpace China’s? Not necessarily.
As quoted in an article published in Business Standard, Madan Sabnavis, Chief Economist of the Bank of Baroda says that India needs to increase its labor participation, as well as general access to education, in order to reap the benefits of its increasing working-age population.
As of 2022, India’s workforce participation rate sits at 46%, compared to China’s 68%. How will this change in the future?

This article was published as a part of Visual Capitalist's Creator Program, which features data-driven visuals from some of our favorite Creators around the world.


Demographics
Mapped: U.S. Immigrants by Region
This map shows which regions U.S. immigrants came from, highlighting Asia and Latin America as the biggest sources.


Breaking Down America’s Immigrant Population
This was originally posted on our Voronoi app. Download the app for free on iOS or Android and discover incredible data-driven charts from a variety of trusted sources.
The United States is home to more immigrants than any other nation, surpassing the combined totals of the next four countries: Germany, Saudi Arabia, Russia, and the United Kingdom.
To add context to this impressive fact, we’ve illustrated the regions from which U.S. immigrants originated. “Immigrants” in this context refers to individuals who are residing in the United States but were not U.S. citizens at birth.
These statistics were sourced from the Migration Policy Institute, which analyzed data from the U.S. Census Bureau’s 2022 American Community Survey (ACS).
U.S. Immigrants by Region
From this graphic, we can see that Asia and Latin America emerge as the primary sources of immigration, collectively accounting for 81% of America’s 46.2 million immigrants.
| Region | # of Immigrants | % of Total |
|---|---|---|
| Europe | 4,728,948 | 10 |
| Asia | 14,349,080 | 31 |
| Africa | 2,752,965 | 6 |
| Oceania | 288,560 | 1 |
| Northern America | 828,702 | 2 |
| Latin America | 23,233,834 | 50 |
| Total | 46,182,089 | 100 |
Latin America alone contributes half of the immigrant population. Mexico stands out as the largest contributor to U.S. immigration, with 10.7 million immigrants, attributable to its geographical proximity and historical ties.
Economic factors, including wage disparity and employment opportunities, drive many Mexicans to seek better prospects north of the border.
From Asia, the two largest country sources are China (2.2 million) and India (2.8 million).
Learn More About U.S. Immigration From Visual Capitalist
If you enjoyed this post, be sure to check out Why Do People Immigrate to the U.S.? This visualization shows the different reasons why immigrants chose to come to America in 2021.

-

 Mining6 days ago
Where the World’s Aluminum is Smelted, by Country
-

 Markets2 weeks ago
Visualized: Interest Rate Forecasts for Advanced Economies
-

 Economy2 weeks ago
The Most Valuable Companies in Major EU Economies
-

 Markets2 weeks ago
The World’s Fastest Growing Emerging Markets (2024-2029 Forecast)
-

 Markets2 weeks ago
Visualizing Global Inflation Forecasts (2024-2026)
-

 Politics2 weeks ago
Charted: What Southeast Asia Thinks About China & the U.S.
-

 Misc1 week ago
The Evolution of U.S. Beer Logos
-

 Healthcare1 week ago
What Causes Preventable Child Deaths?