Demographics
Mapped: The World’s Indigenous Peoples
Article/Editing:
View a higher resolution version of graphic.
Mapped: The World’s Indigenous Peoples
Humanity has spread to almost every corner of Earth, and while some peoples have continued to move, others have grown roots in one region.
Generally the term indigenous peoples refers to social or cultural groups with strong ancestral ties to their land of origin. Many times these are tied to ethnicity and still live in their land of origin, but some have been displaced, diluted, or become minorities in their lands.
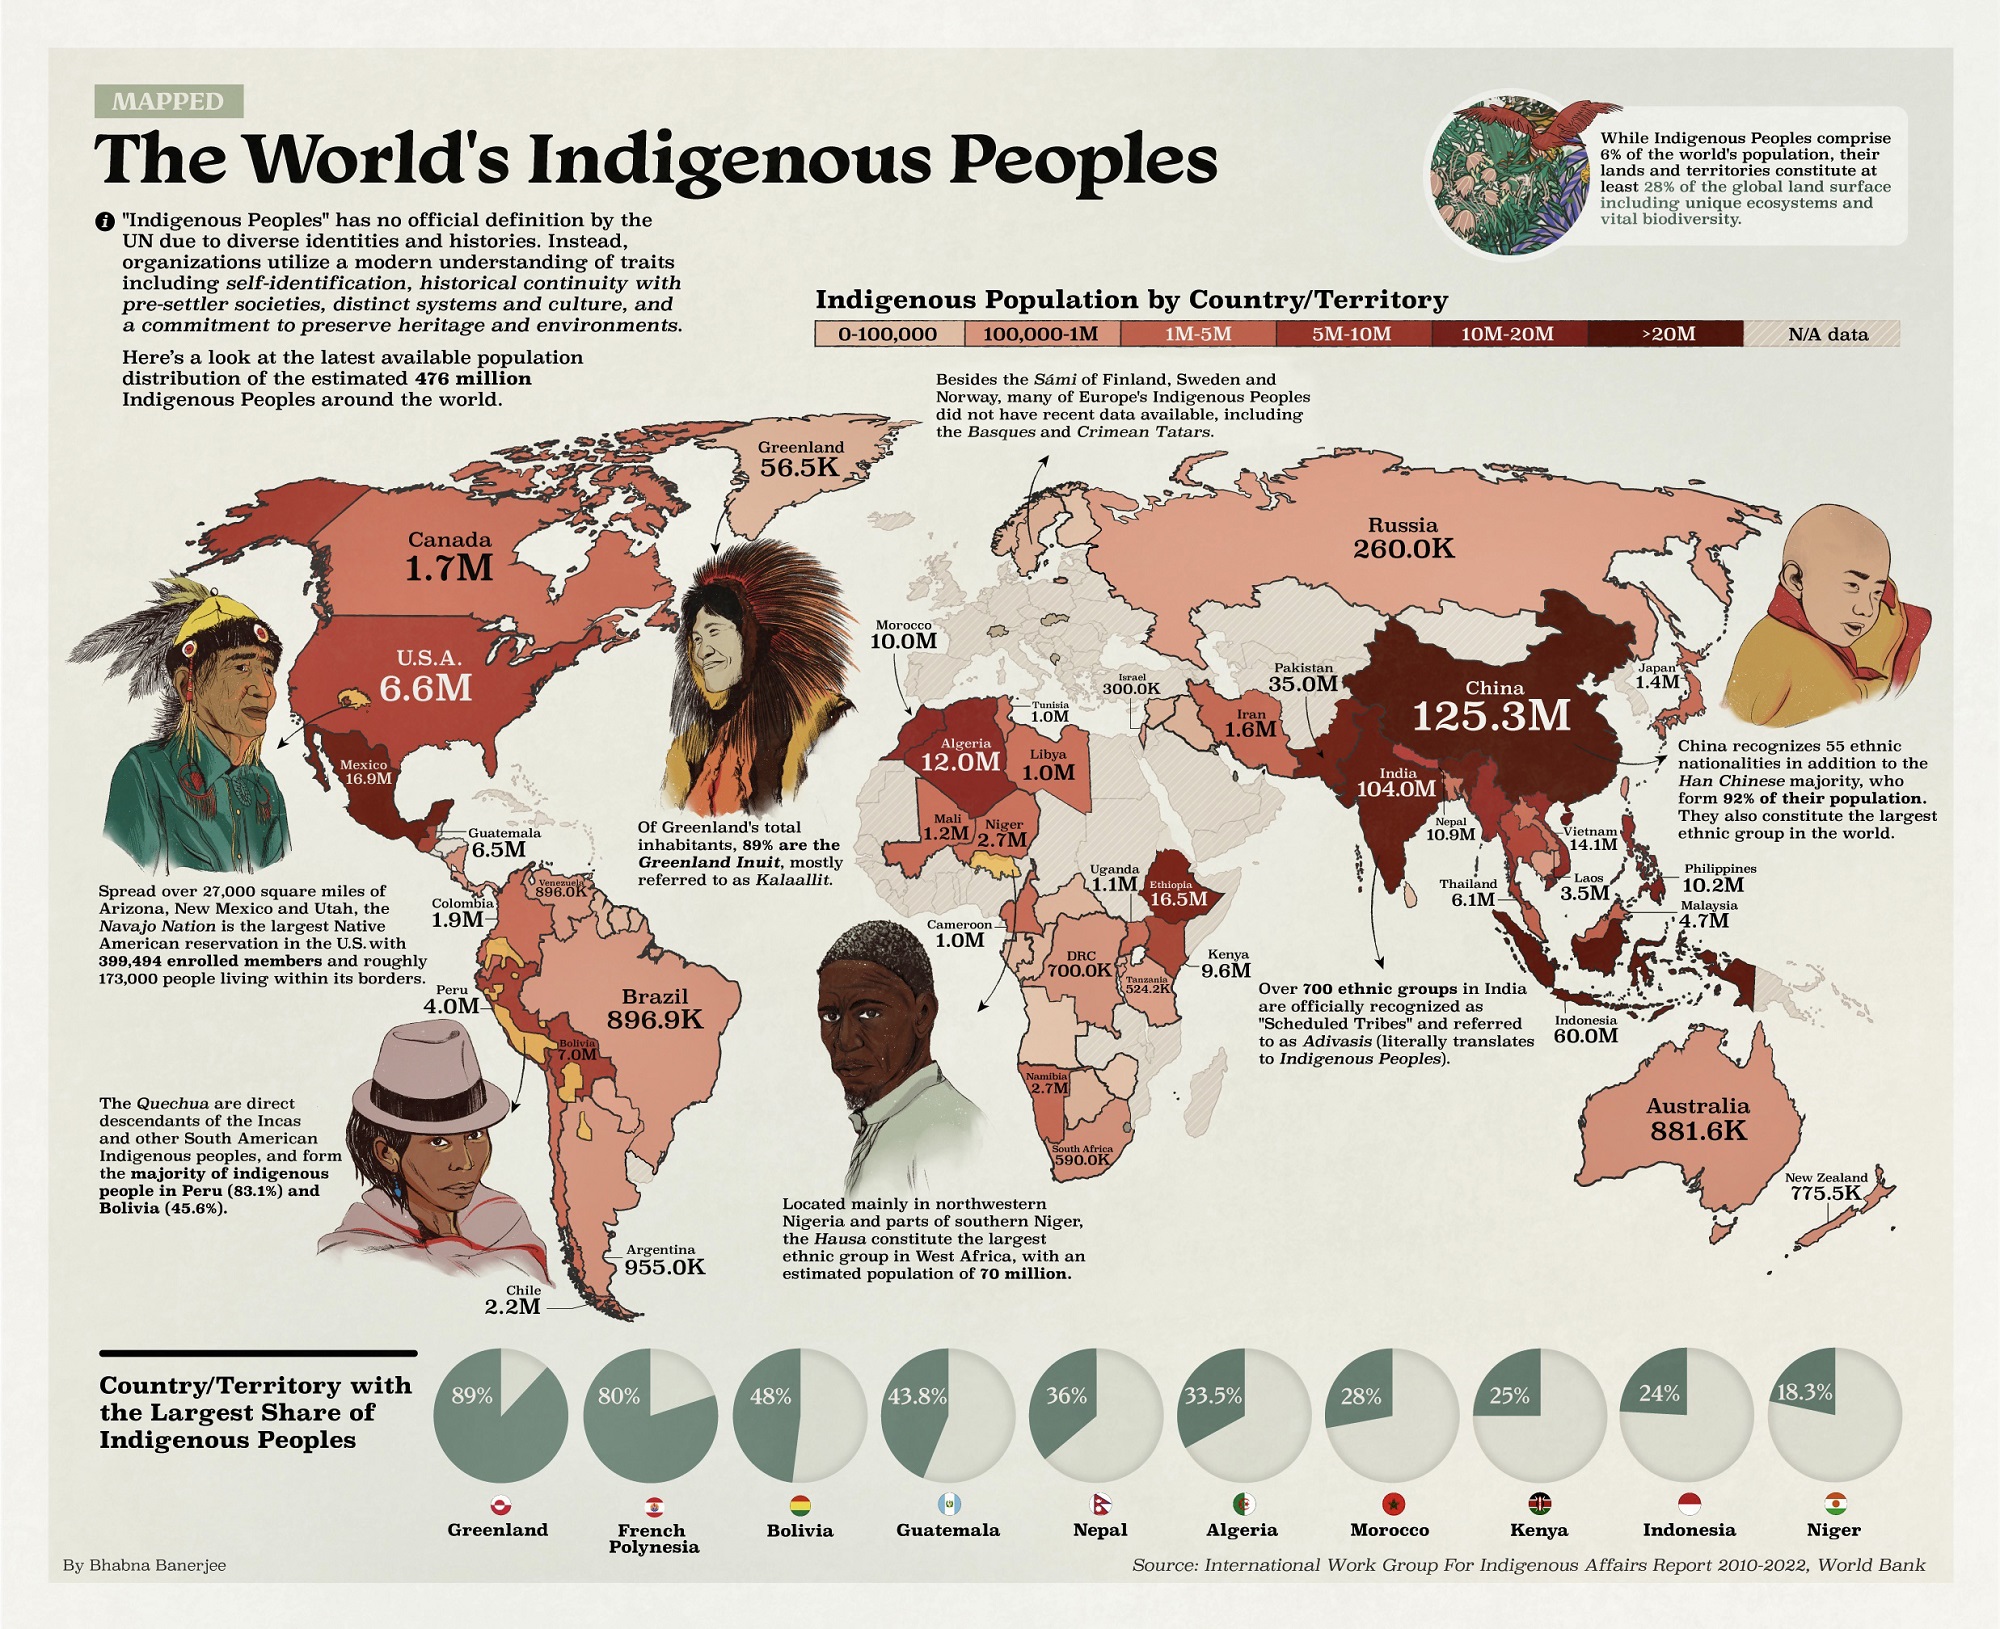
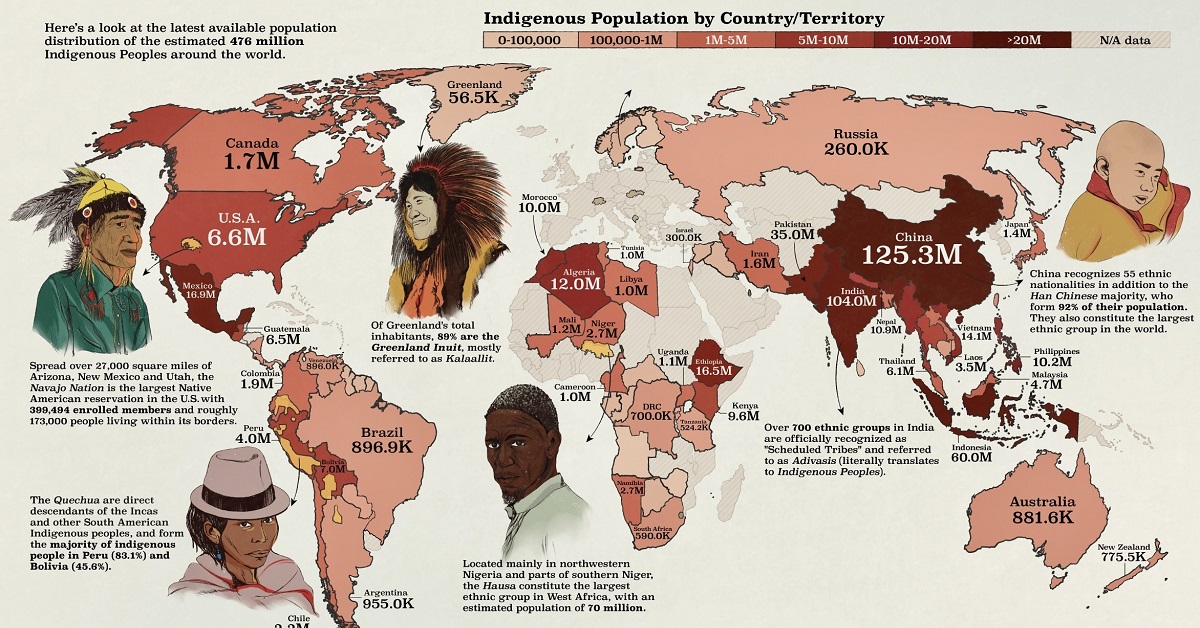
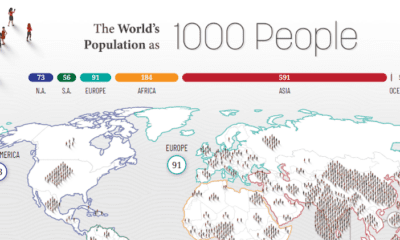
This map by Bhabna Banerjee uses data from the Indigenous World 2022 report to show the population distribution of the roughly 476 million Indigenous peoples around the world. When 2022 data was unavailable, the latest available data was used.
What Are “Indigenous” Peoples?
Before diving in, it’s important to note that this map and report are based on the United Nations’ approach to indigenous peoples.
Due to the diversity and difficult history experienced by these groups, including countries that don’t recognize indigenous peoples in their lands, there is purposefully no official definition of “indigenous.”
Instead, the UN and other organizations working with indigenous peoples utilize an understanding based on self-determination that includes:
- Self-identification as indigenous peoples at the individual level and accepted by the community.
- Historical continuity with pre-colonial and/or pre-settler societies
- Strong link to territories and surrounding resources
- Distinct social, economic, or political systems
- Distinct language, culture, and beliefs
- Forms non-dominant groups of society
- Resolve to maintain and reproduce their ancestral environments and systems
Because of this, ethnic groups that are indigenous (as a dictionary term) to their lands like the Han people in China, the Turks in Turkey, or the Scots in Scotland were not included in this report.
On the flip side, groups like Greenland’s Inuit were included, because of their long history of colonial control as well as Danish influence.
Indigenous Populations Worldwide
Of all the countries included in the report, China has the highest number of Indigenous, with an estimated population of 125.3 million.
It’s worth noting that the Chinese government does not officially acknowledge the existence of Indigenous peoples. However, they do recognize 55 different ethnic nationalities across the nation, including the Zhuang, Mongolians, and the Hui.
| Country | Indigenous Population | Year of Data |
|---|---|---|
| China | 125,332,335 | 2022 |
| India | 104,000,000 | 2022 |
| Indonesia | 60,000,000 | 2022 |
| Pakistan | 35,000,000 | 2010 |
| Mexico | 16,933,283 | 2022 |
| Ethiopia | 16,500,000 | 2022 |
| Myanmmar | 14,400,000 | 2010 |
| Vietnam | 14,100,000 | 2022 |
| Algeria | 12,000,000 | 2022 |
| Nepal | 10,872,000 | 2022 |
| Morocoo | 10,000,000 | 2022 |
| Phillippines | 10,000,000 | 2022 |
| Kenya | 9,650,000 | 2021 |
| Bolivia | 7,000,000 | 2013 |
| United States | 6,600,000 | 2022 |
| Guatemala | 6,500,000 | 2022 |
| Thailand | 6,100,000 | 2022 |
| Malaysia | 4,683,000 | 2022 |
| Peru | 4,000,000 | 2022 |
| Laos | 3,500,000 | 2022 |
| Niger | 2,690,000 | 2022 |
| Namibia | 2,678,191 | 2022 |
| Chile | 2,185,792 | 2022 |
| Colombia | 1,905,617 | 2022 |
| Canada | 1,673,785 | 2022 |
| Iran | 1,617,000 | 2021 |
| Bangladesh | 1,586,141 | 2022 |
| Japan | 1,400,000 | 2021 |
| Mali | 1,200,000 | 2016 |
| Uganda | 1,138,239 | 2022 |
| Ecuador | 1,100,000 | 2022 |
| Cameroon | 1,044,300 | 2022 |
| Libya | 1,000,000 | 2022 |
| Tunisia | 1,000,000 | 2022 |
| Argentina | 955,032 | 2022 |
| Brazil | 896,900 | 2022 |
| Venzuela | 896,000 | 2022 |
| Australia | 881,600 | 2022 |
| New Zealand | 775,500 | 2022 |
| DRC | 700,000 | 2022 |
| Nicaragua | 612,000 | 2022 |
| SouthAfrica | 590,000 | 2022 |
| Taiwan | 580,758 | 2022 |
| Tanzania | 524,246 | 2022 |
| Panama | 417,559 | 2022 |
| Israel | 300,000 | 2022 |
| Russia | 260,000 | 2022 |
| Cambodia | 250,000 | 2022 |
| French Polynesia | 222,400 | 2022 |
| Paraguay | 122,461 | 2022 |
| Costa Rica | 104,143 | 2022 |
| Guyana | 78,500 | 2022 |
| Burundi | 78,071 | 2022 |
| Iraq | 78,000 | 2007 |
| Botswana | 73,100 | 2022 |
| Greenland | 56,523 | 2022 |
| Norway | 50,000 | 2021 |
| Rep. of Congo | 43,378 | 2022 |
| CAR | 39,299 | 2022 |
| Jordan | 27,000 | 2021 |
| Rwanda | 25,000 | 2022 |
| Angola | 24,300 | 2022 |
| Suriname | 20,344 | 2022 |
| Sweden | 20,000 | 2021 |
| Gabon | 16,162 | 2020 |
| French Guiana | 10,000 | 2022 |
| Finland | 8000 | 2021 |
| Zimbabwe | 4533 | 2022 |
| Sri Lanka | 1229 | 2012 |
After China, India has the second largest Indigenous populations, with over 700 officially recognized ethnic groups. Many of these are concentrated in the north-eastern region of India, from Rajasthan to West Bengal.
While different countries and territories have varying numbers of Indigenous peoples, one thing remains consistent across the board—on average, the world’s Indigenous populations typically face greater economic and social challenges than their non-Indigenous counterparts.
Disadvantages Faced by Indigenous Peoples
Research by the UN’s International Labour Organization (ILO) found that, while Indigenous peoples make up only 6% of the world’s total population, they account for nearly 20% of the world’s extreme poor.
In addition, Indigenous peoples also have much lower average life expectancies than non-Indigenous people, according to a report by the United Nations.
Some countries and governments around the world are starting to implement laws and policies to support and recognize Indigenous communities, but there’s still work to be done.

This article was published as a part of Visual Capitalist's Creator Program, which features data-driven visuals from some of our favorite Creators around the world.


Demographics
The Countries That Have Become Sadder Since 2010
Tracking Gallup survey data for more than a decade reveals some countries are witnessing big happiness declines, reflecting their shifting socio-economic conditions.


The Countries That Have Become Sadder Since 2010
This was originally posted on our Voronoi app. Download the app for free on iOS or Android and discover incredible data-driven charts from a variety of trusted sources.
Can happiness be quantified?
Some approaches that try to answer this question make a distinction between two differing components of happiness: a daily experience part, and a more general life evaluation (which includes how people think about their life as a whole).
The World Happiness Report—first launched in 2012—has been making a serious go at quantifying happiness, by examining Gallup poll data that asks respondents in nearly every country to evaluate their life on a 0–10 scale. From this they extrapolate a single “happiness score” out of 10 to compare how happy (or unhappy) countries are.
More than a decade later, the 2024 World Happiness Report continues the mission. Its latest findings also include how some countries have become sadder in the intervening years.
Which Countries Have Become Unhappier Since 2010?
Afghanistan is the unhappiest country in the world right now, and is also 60% unhappier than over a decade ago, indicating how much life has worsened since 2010.
In 2021, the Taliban officially returned to power in Afghanistan, after nearly two decades of American occupation in the country. The Islamic fundamentalist group has made life harder, especially for women, who are restricted from pursuing higher education, travel, and work.
On a broader scale, the Afghan economy has suffered post-Taliban takeover, with various consequent effects: mass unemployment, a drop in income, malnutrition, and a crumbling healthcare system.
| Rank | Country | Happiness Score Loss (2010–24) | 2024 Happiness Score (out of 10) |
|---|---|---|---|
| 1 | 🇦🇫 Afghanistan | -2.6 | 1.7 |
| 2 | 🇱🇧 Lebanon | -2.3 | 2.7 |
| 3 | 🇯🇴 Jordan | -1.5 | 4.2 |
| 4 | 🇻🇪 Venezuela | -1.3 | 5.6 |
| 5 | 🇲🇼 Malawi | -1.2 | 3.4 |
| 6 | 🇿🇲 Zambia | -1.2 | 3.5 |
| 7 | 🇧🇼 Botswana | -1.2 | 3.4 |
| 8 | 🇾🇪 Yemen | -1.0 | 3.6 |
| 9 | 🇪🇬 Egypt | -1.0 | 4.0 |
| 10 | 🇮🇳 India | -0.9 | 4.1 |
| 11 | 🇧🇩 Bangladesh | -0.9 | 3.9 |
| 12 | 🇨🇩 DRC | -0.7 | 3.3 |
| 13 | 🇹🇳 Tunisia | -0.7 | 4.4 |
| 14 | 🇨🇦 Canada | -0.6 | 6.9 |
| 15 | 🇺🇸 U.S. | -0.6 | 6.7 |
| 16 | 🇨🇴 Colombia | -0.5 | 5.7 |
| 17 | 🇵🇦 Panama | -0.5 | 6.4 |
| 18 | 🇵🇰 Pakistan | -0.5 | 4.7 |
| 19 | 🇿🇼 Zimbabwe | -0.5 | 3.3 |
| 20 | 🇮🇪 Ireland | -0.5 | 6.8 |
| N/A | 🌍 World | +0.1 | 5.5 |
Nine countries in total saw their happiness score drop by a full point or more, on the 0–10 scale.
Noticeably, many of them have seen years of social and economic upheaval. Lebanon, for example, has been grappling with decades of corruption, and a severe liquidity crisis since 2019 that has resulted in a banking system collapse, sending poverty levels skyrocketing.
In Jordan, unprecedented population growth—from refugees leaving Iraq and Syria—has aggravated unemployment rates. A somewhat abrupt change in the line of succession has also raised concerns about political stability in the country.

-

 Markets6 days ago
The Best U.S. Companies to Work for According to LinkedIn
-

 VC+2 weeks ago
VC+: Get Our Key Takeaways From the IMF’s World Economic Outlook
-

 Demographics2 weeks ago
The Countries That Have Become Sadder Since 2010
-

 Money2 weeks ago
Charted: Who Has Savings in This Economy?
-

 Technology2 weeks ago
Visualizing AI Patents by Country
-

 Economy2 weeks ago
Economic Growth Forecasts for G7 and BRICS Countries in 2024
-

 Wealth1 week ago
Charted: Which City Has the Most Billionaires in 2024?
-

 Technology1 week ago
All of the Grants Given by the U.S. CHIPS Act