Countries
Mapped: How Global Housing Prices Have Changed Since 2010
Article/Editing:
How Global Housing Prices Have Changed Since 2010
In many countries around the world, it seems like house prices have been constantly climbing.
Houses fulfill a rare mix of necessity, utility, sentimentality, and for many, also act as a primary investment to build wealth. And it’s that last angle, combined with increasing demand in many countries, that is driving housing prices skyward.
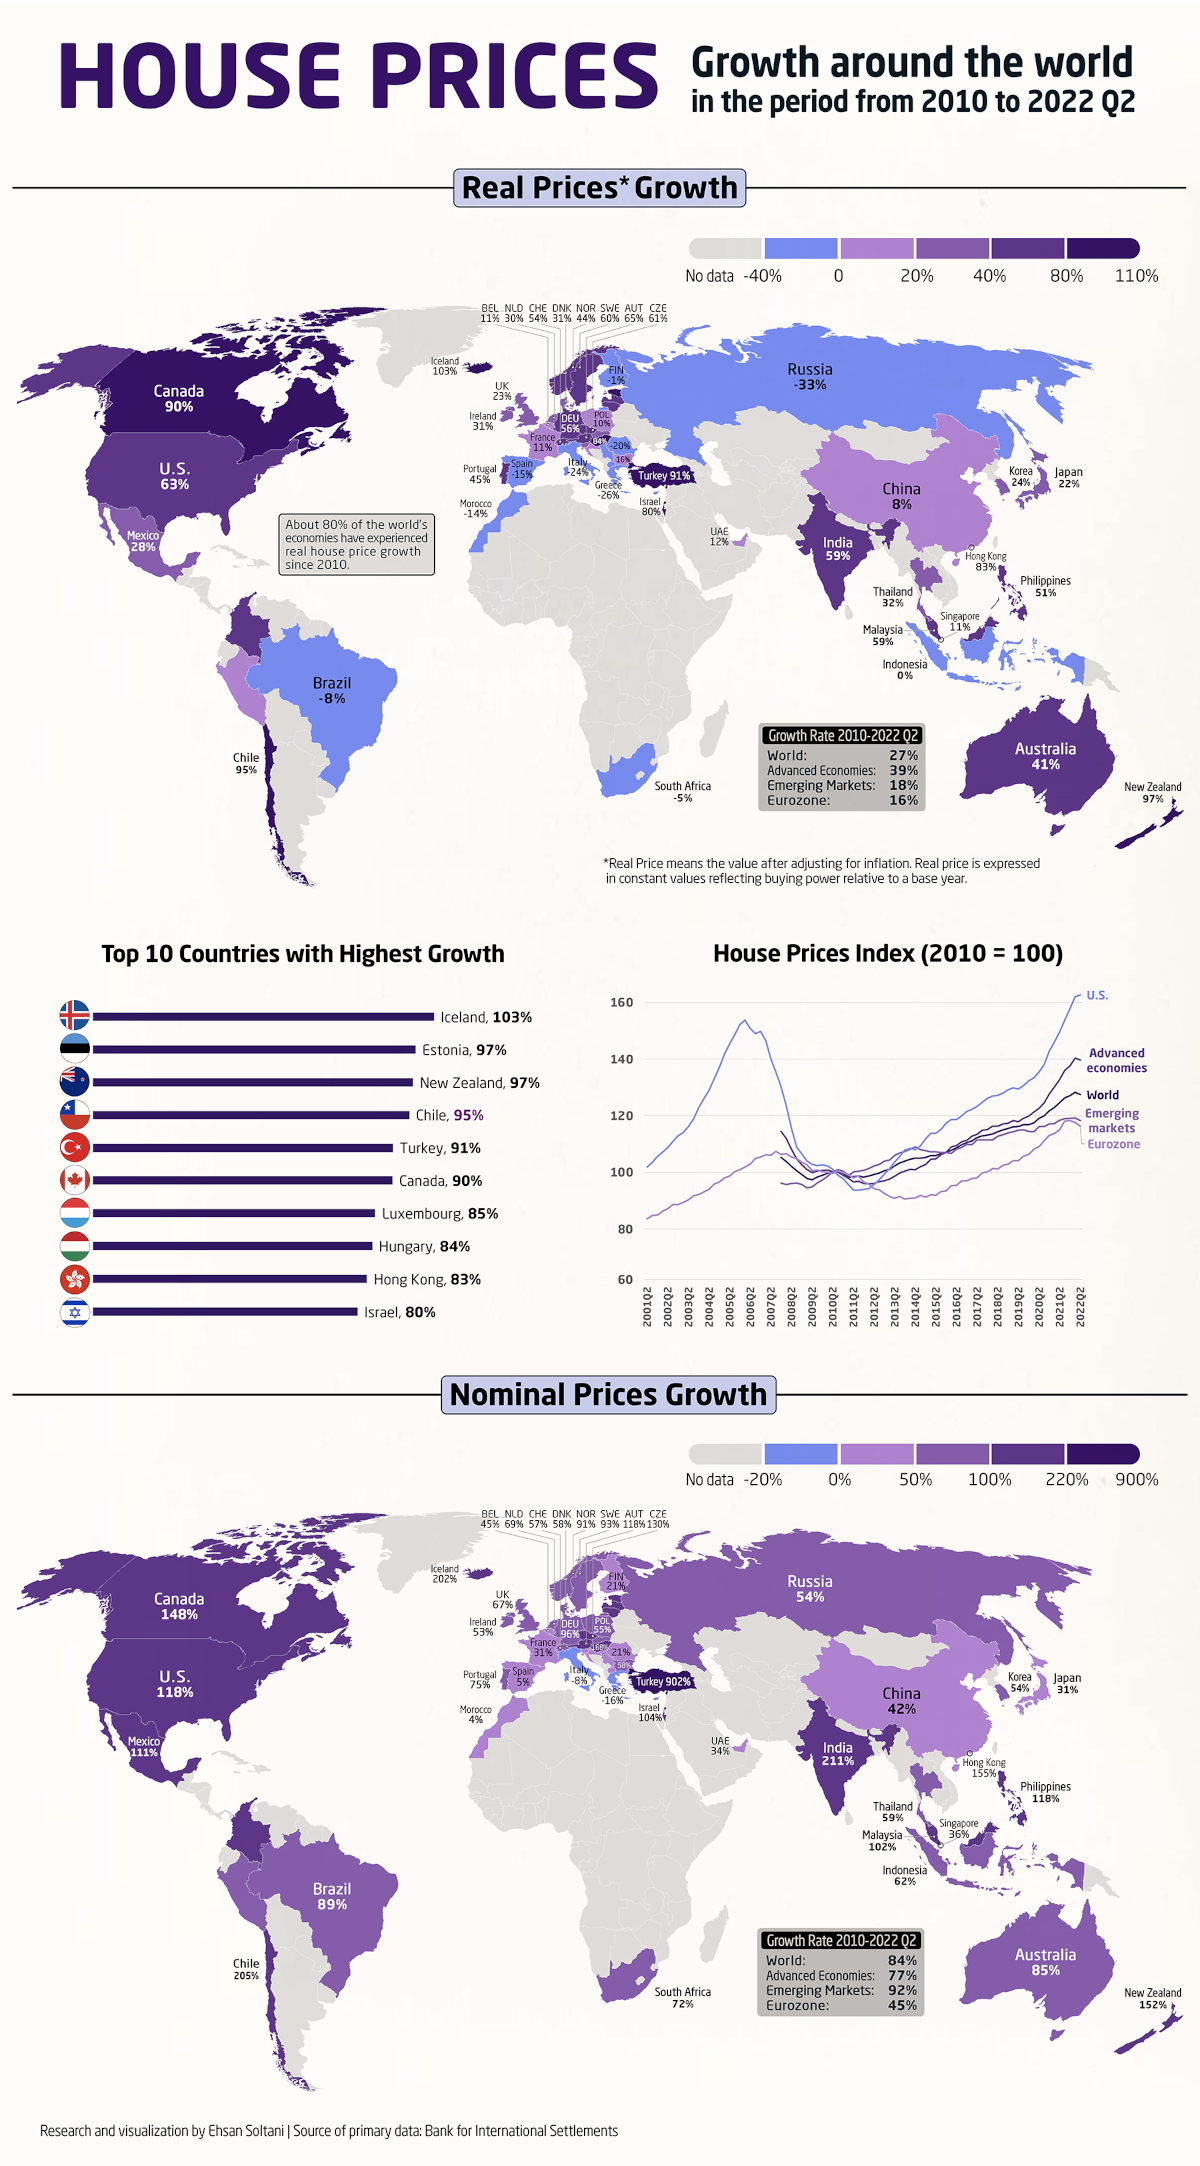
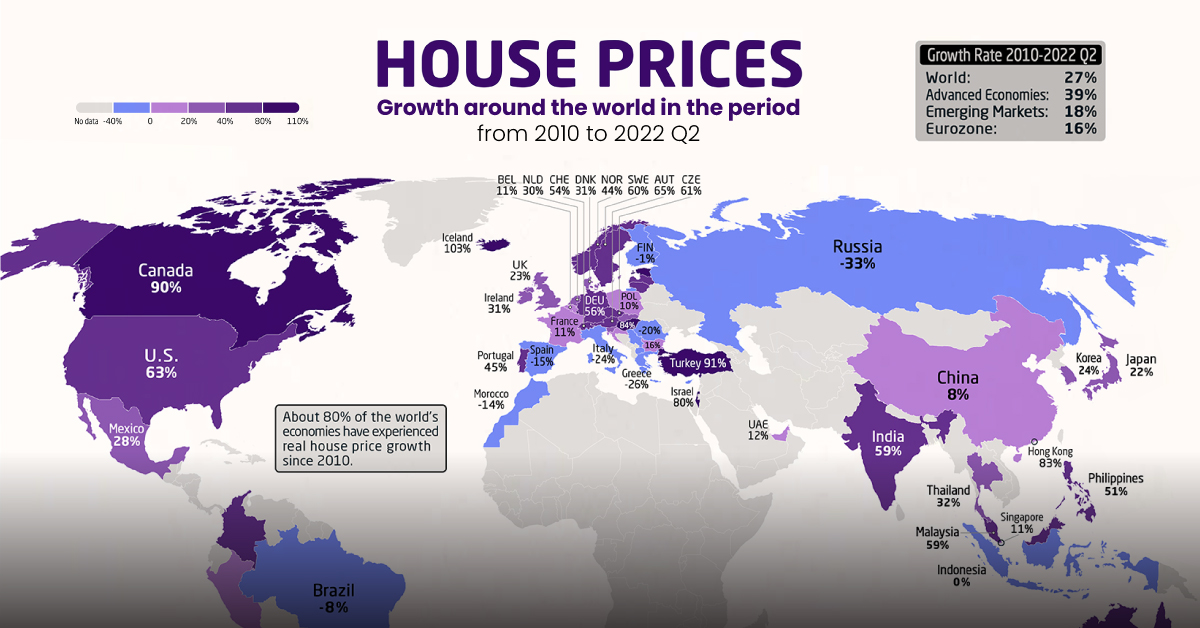
Using data from the Bank of International Settlements, Ehsan Soltani has ranked the change in real residential property prices for 57 countries from 2010 to 2022.
In the dataset of 57 countries, 80% have seen increases in housing prices in the last 12 years.
| Real Price Growth | Nominal Price Growth | |
|---|---|---|
| Advanced economies | 39% | 77% |
| World | 27% | 84% |
| Emerging market economies | 18% | 92% |
| Eurozone | 16% | 45% |
Advanced economies, or the most developed countries in the world, have seen the highest increases. But across all measured countries, the real price of housing has increased nearly 30% on average since 2010.
Countries with Increased Housing Prices (2010‒2022)
Leading the group of 45 countries with increased housing prices is Iceland, with local real prices more than doubling since 2010.
| Housing Prices by Country | Real Price Growth | Nominal Price Growth |
|---|---|---|
| 🇮🇸 Iceland | 103% | 202% |
| 🇪🇪 Estonia | 97% | 196% |
| 🇳🇿 New Zealand | 97% | 152% |
| 🇨🇱 Chile | 95% | 205% |
| 🇹🇷 Turkey | 91% | 902% |
| 🇨🇦 Canada | 90% | 148% |
| 🇱🇺 Luxembourg | 85% | 135% |
| 🇭🇺 Hungary | 84% | 168% |
| 🇭🇰 Hong Kong | 83% | 155% |
| 🇮🇱 Israel | 80% | 104% |
| 🇱🇻 Latvia | 66% | 131% |
| 🇦🇹 Austria | 65% | 118% |
| 🇺🇸 United States | 63% | 118% |
| 🇨🇿 Czechia | 61% | 130% |
| 🇸🇪 Sweden | 60% | 93% |
| 🇮🇳 India | 59% | 211% |
| 🇲🇾 Malaysia | 59% | 102% |
| 🇱🇹 Lithuania | 57% | 130% |
| 🇩🇪 Germany | 56% | 96% |
| 🇨🇭 Switzerland | 54% | 57% |
| 🇵🇭 Philippines | 51% | 118% |
| 🇵🇹 Portugal | 45% | 75% |
| 🇳🇴 Norway | 44% | 91% |
| 🇨🇴 Colombia | 43% | 133% |
| 🇦🇺 Australia | 41% | 85% |
| 🇸🇰 Slovak Republic | 34% | 81% |
| 🇹🇭 Thailand | 32% | 59% |
| 🇩🇰 Denmark | 31% | 58% |
| 🇮🇪 Ireland | 31% | 53% |
| 🇲🇹 Malta | 30% | 59% |
| 🇳🇱 Netherlands | 30% | 69% |
| 🇲🇽 Mexico | 28% | 111% |
| 🇰🇷 South Korea | 24% | 54% |
| 🇬🇧 United Kingdom | 23% | 67% |
| 🇯🇵 Japan | 22% | 31% |
| 🇸🇮 Slovenia | 20% | 47% |
| 🇵🇪 Peru | 18% | 73% |
| 🇧🇬 Bulgaria | 16% | 58% |
| 🇭🇷 Croatia | 15% | 43% |
| 🇦🇪 United Arab Emirates | 12% | 34% |
| 🇧🇪 Belgium | 11% | 45% |
| 🇫🇷 France | 11% | 31% |
| 🇸🇬 Singapore | 11% | 36% |
| 🇵🇱 Poland | 10% | 55% |
| 🇨🇳 China | 8% | 42% |
Other countries with a 85% or higher increases in housing prices include Estonia, New Zealand, Chile, Turkey, Canada, and Luxembourg. As emerging market economies, Turkey and Chile are the outliers in this group of mostly advanced economies.
Many other emerging market economies also saw housing prices increase. In India and Malaysia, housing prices are up by 59%. Likewise, the Philippines (50%) and Colombia (40%) also saw real prices increase faster than the global average.
However, not all countries logged big housing price increases. Some countries in Europe, including France, Belgium, and Croatia, and Asia, including China, and Singapore, all saw less than 20% growth in real prices.
Countries with Decreased Housing Prices (2010‒2022)
Some countries bucked the global trend and actually saw real housing prices fall over the last 12 years:
| Housing Prices by Country | Real Price Growth | Nominal Price Growth |
|---|---|---|
| 🇮🇩 Indonesia | 0% | 62% |
| 🇫🇮 Finland | -1% | 21% |
| 🇿🇦 South Africa | -5% | 72% |
| 🇲🇰 North Macedonia | -7% | 23% |
| 🇧🇷 Brazil | -8% | 89% |
| 🇷🇸 Serbia | -11% | 49% |
| 🇲🇦 Morocco | -14% | 4% |
| 🇪🇸 Spain | -15% | 5% |
| 🇷🇴 Romania | -20% | 21% |
| 🇮🇹 Italy | -24% | -8% |
| 🇬🇷 Greece | -26% | -16% |
| 🇷🇺 Russia | -33% | 54% |
Russia, Greece, and Italy saw the largest contractions in prices, all with housing price drops of more than 20%.
But these cases also allow us to see inflation in action. In Russia for example, despite real housing prices contracting by 33%, nominal prices (which don’t account for inflation) are up more than 50%. In South Africa, where real prices have fallen 5%, nominal prices are up 72%.
Is Your Country in a Housing Bubble?
From the housing prices of countries listed above, the data can point to the emergence of potential housing bubbles in Iceland, New Zealand, and Canada.
However, bubbles are usually only fully identified and measured after they have burst (or have started to). Otherwise, if their inflated values hold through sudden changes in market conditions, they can simply point to more accurately-priced demand.
There are a variety of reasons that can lead to housing price growth. Some of them are listed below, taken from a speech delivered by the deputy governor of the Bank of Canada back in 2015:
| Macroeconomic | Rising disposable incomes, lower long-term interest rates. |
| Demographic | Population growth, increased migration, and shifts in family structure. |
| Credit conditions | Broader access to and more efficient funding of mortgage credit. |
| Other factors | Improvements to macro-policy framework, international investment, and regulatory and tax changes. |
And specific local factors also play a part in many markets. In Iceland for example, tourism growth and the surge in short-term rentals have also contributed to the housing crisis.
Meanwhile, in the U.S., restricted housing supply is one of the factors pushing prices up.
When you factor in successive interest rate hikes to combat inflation and rising mortgage rates, the housing market remains at the forefront of discussion more so than ever. The question is, what comes next for the world’s housing prices?

This article was published as a part of Visual Capitalist's Creator Program, which features data-driven visuals from some of our favorite Creators around the world.


Demographics
Countries With the Largest Happiness Gains Since 2010
Tracking Gallup survey data for more than a decade reveals insights into the regions seeing happiness gains.
Countries With the Largest Happiness Gains Since 2010
This was originally posted on our Voronoi app. Download the app for free on iOS or Android and discover incredible data-driven charts from a variety of trusted sources.
In 2011, Bhutan sponsored a UN resolution that invited governments to prioritize happiness and well-being as a way to measure social and economic development.
And thus, the World Happiness Report was born.
In 2012, the first report released, examining Gallup poll data from 2006–2010 that asked respondents in nearly every country to evaluate their life on a 0–10 scale. From this they extrapolated a single “happiness score” out of 10 to compare how happy countries are.
More than a decade later, the 2024 World Happiness Report continues the mission to quantify, measure, and compare well-being. Its latest findings also include how countries have become happier in the intervening years.
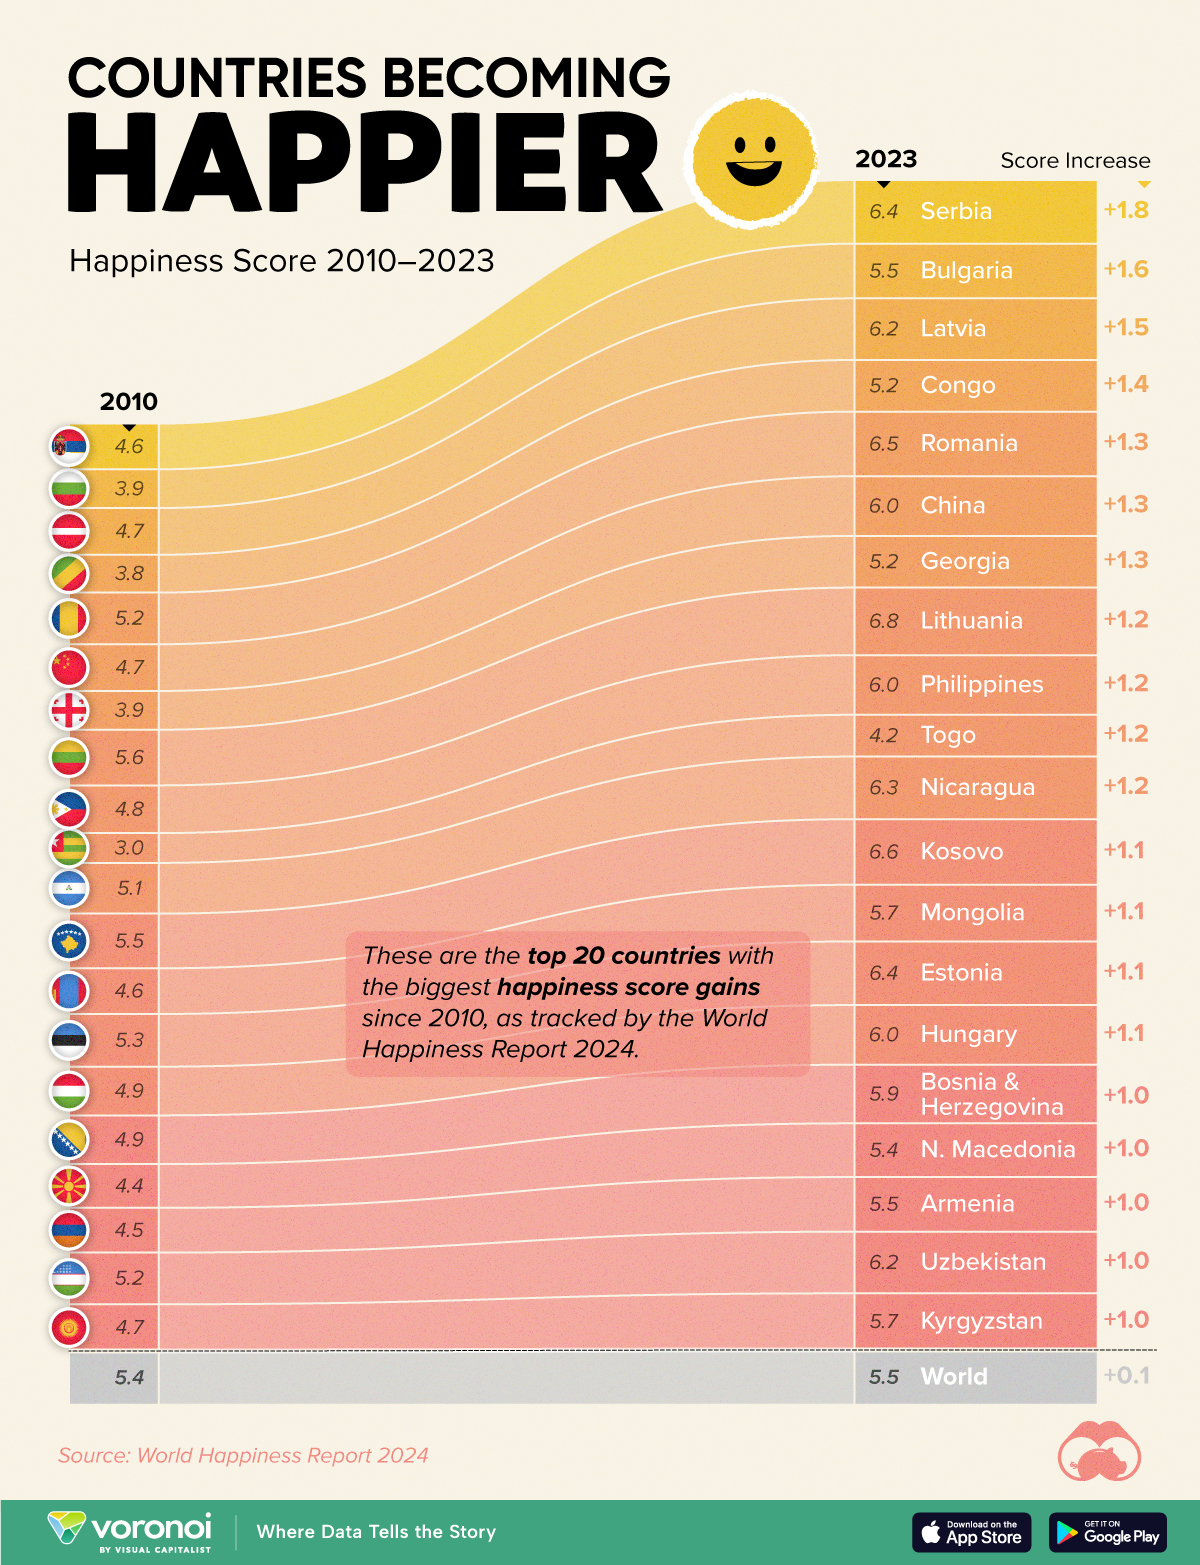
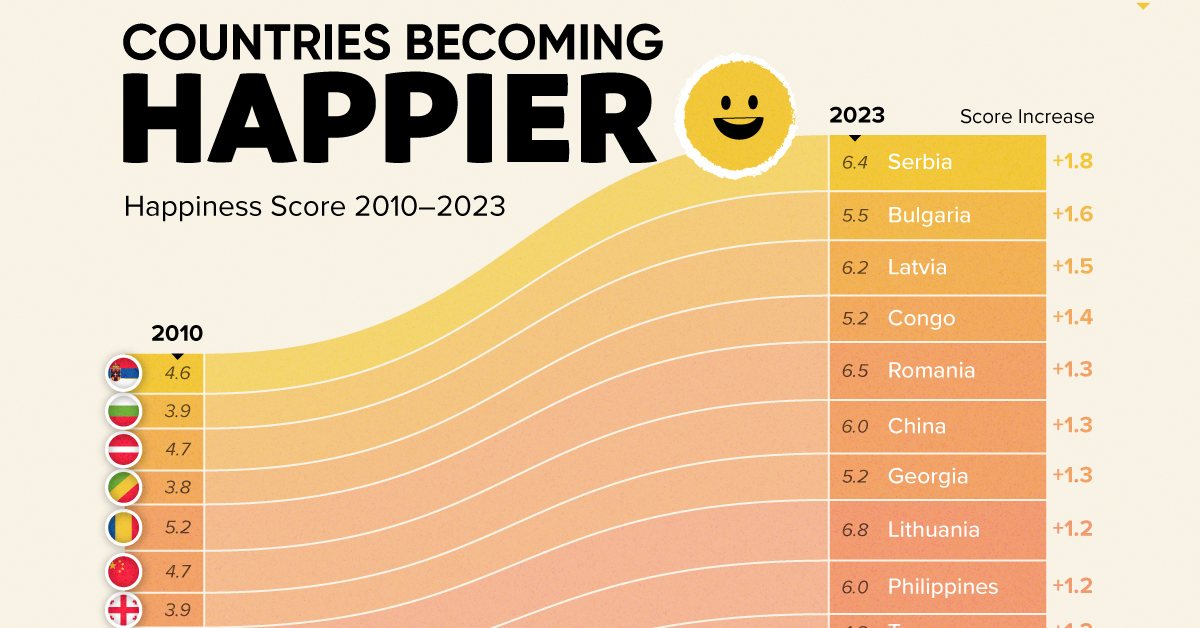
We visualize these findings in the above chart, which shows the 20 countries that have seen their happiness scores grow the most since 2010.
Which Countries Have Become Happier Since 2010?
Serbia leads a list of 12 Eastern European nations whose average happiness score has improved more than 20% in the last decade.
In the same time period, the Serbian economy has doubled to $80 billion, and its per capita GDP has nearly doubled to $9,538 in current dollar terms.
| Rank | Country | Happiness Score Gains (2010–2024) | 2024 Happiness Score (out of 10) |
|---|---|---|---|
| 1 | 🇷🇸 Serbia | +1.8 | 6.4 |
| 2 | 🇧🇬 Bulgaria | +1.6 | 5.5 |
| 3 | 🇱🇻 Latvia | +1.5 | 6.2 |
| 4 | 🇨🇬 Congo | +1.4 | 5.2 |
| 5 | 🇷🇴 Romania | +1.3 | 6.5 |
| 6 | 🇨🇳 China | +1.3 | 6.0 |
| 7 | 🇬🇪 Georgia | +1.3 | 5.2 |
| 8 | 🇱🇹 Lithuania | +1.2 | 6.8 |
| 9 | 🇵🇭 Philippines | +1.2 | 6.0 |
| 10 | 🇹🇬 Togo | +1.2 | 4.2 |
| 11 | 🇳🇮 Nicaragua | +1.2 | 6.3 |
| 12 | 🇽🇰 Kosovo | +1.1 | 6.6 |
| 13 | 🇲🇳 Mongolia | +1.1 | 5.7 |
| 14 | 🇪🇪 Estonia | +1.1 | 6.4 |
| 15 | 🇭🇺 Hungary | +1.1 | 6.0 |
| 16 | 🇧🇦 Bosnia & Herzegovina | +1.0 | 5.9 |
| 17 | 🇲🇰 North Macedonia | +1.0 | 5.4 |
| 18 | 🇦🇲 Armenia | +1.0 | 5.5 |
| 19 | 🇺🇿 Uzbekistan | +1.0 | 6.2 |
| 20 | 🇰🇬 Kyrgyzstan | +1.0 | 5.7 |
| N/A | 🌍 World | +0.1 | 5.5 |
Since the first report, Western Europe has on average been happier than Eastern Europe. But as seen with these happiness gains, Eastern Europe is now seeing their happiness levels converge closer to their Western counterparts. In fact, when looking at those under the age of 30, the most recent happiness scores are nearly the same across the continent.
All in all, 20 countries have increased their happiness score by a full point or more since 2010, on the 0–10 scale.

-

 Mining7 days ago
Where the World’s Aluminum is Smelted, by Country
-

 Markets2 weeks ago
Visualized: Interest Rate Forecasts for Advanced Economies
-

 Economy2 weeks ago
The Most Valuable Companies in Major EU Economies
-

 Markets2 weeks ago
The World’s Fastest Growing Emerging Markets (2024-2029 Forecast)
-

 Markets2 weeks ago
Visualizing Global Inflation Forecasts (2024-2026)
-

 United States2 weeks ago
Charted: What Southeast Asia Thinks About China & the U.S.
-

 Misc1 week ago
The Evolution of U.S. Beer Logos
-

 Healthcare1 week ago
What Causes Preventable Child Deaths?