Politics
Arms Transfers: U.S. and Russia’s Biggest Trading Partners
Article/Editing:
Arms Transfers: U.S. and Russia’s Biggest Trading Partners
The increase in conflicts worldwide, including in Ukraine and the Middle East, has shifted global focus back onto arms transfers between countries.
For decades, countries proficient in arms manufacturing have supplied weapons to other countries in demand of them. At the helm of these trades are the U.S. and Russia, which have accounted for 57% of all international arms trades in the last 10 years.
So who are the largest importers of arms from these two countries, and what is the military value of these trades?
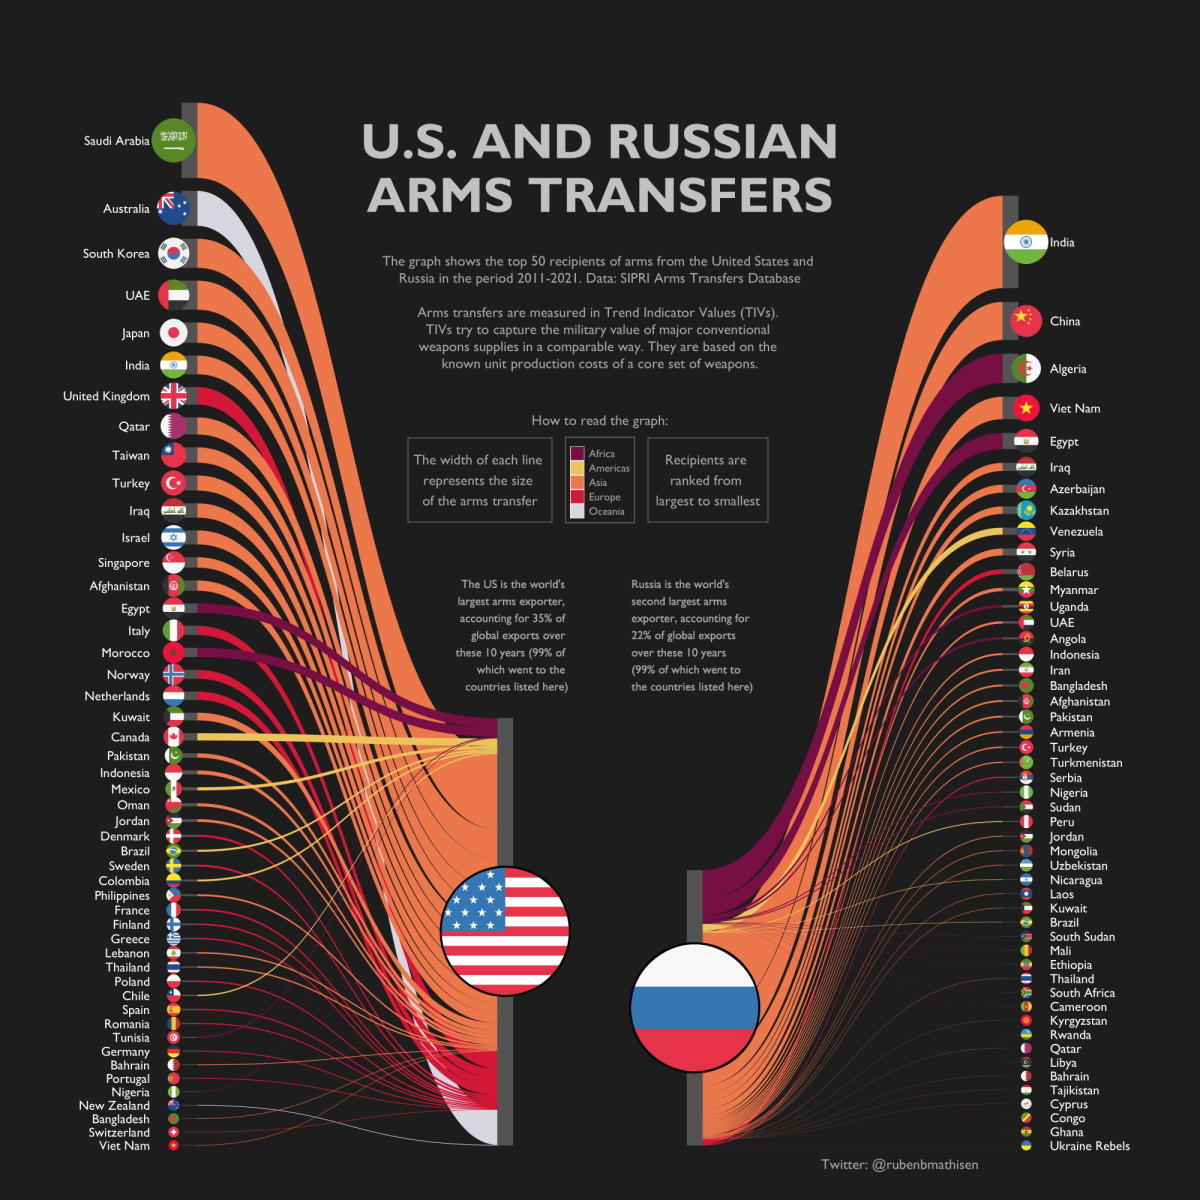
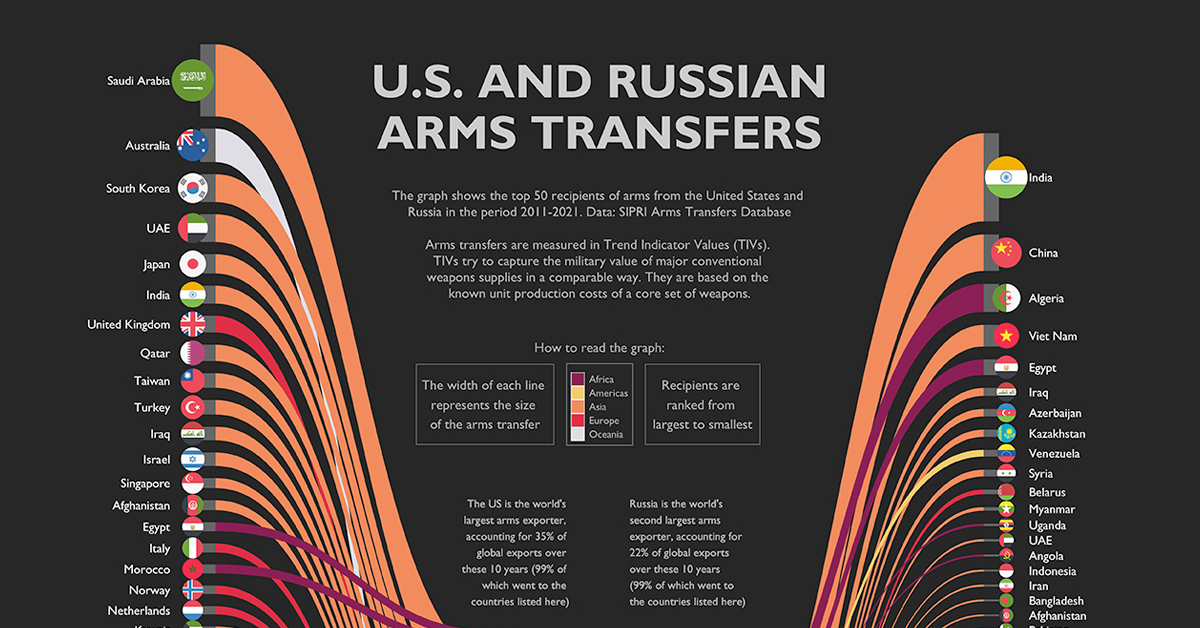
With the help of data from the Stockholm International Peace Research Institute (SIPRI) arms transfer database, the above infographic by Ruben Berge Mathisen visualizes the top 50 biggest arms recipients by value for both the U.S. and Russia in the last decade.
The Military Valuation of Arms Transfers
The military valuation of arms is measured in terms of trend-indicator values (TIV). This valuation reflects the military capability of a particular item rather than its financial value.
Every weapon that falls under the conventional definition of major arms is allotted a TIV. The following are the most common weapons and components to be assigned a TIV.
- Aircraft and armored vehicles
- Artillery (>100mm in caliber)
- Sensors and guided missiles, large air defense guns, torpedoes, and bombs
- 100mm caliber artillery-armed ships (>100-tonne displacement)
- Reconnaissance satellites and air refueling systems
Instead of focusing on budget, examining TIV makes it easier to measure trends in the flow of arms between particular countries and regions over time, essentially creating a military capability price index.
Biggest Recipients of U.S. Armaments
The United States is the largest exporter of arms globally, responsible for 35% of global exports over the last 10 years to about 130 nations.
Most recently, the biggest market for U.S. arms sales has been in the Middle East, with Saudi Arabia being the most prominent recipient of weapons. Over the last decade, the country has purchased 24% of total U.S. arms exports, with components worth over 18 billion TIVs.
Here is a look at the top 50 recipients of arms from the United States:
| U.S. Arms Transfer Recipient | Continent | TIV (Millions) |
|---|---|---|
| 🇸🇦 Saudi Arabia | Asia | 18,641 |
| 🇦🇺 Australia | Oceania | 8,668 |
| 🇰🇷 South Korea | Asia | 7,207 |
| 🇦🇪 UAE | Asia | 7,190 |
| 🇯🇵 Japan | Asia | 5,026 |
| 🇮🇳 India | Asia | 4,614 |
| 🇬🇧 United Kingdom | Europe | 4,332 |
| 🇶🇦 Qatar | Asia | 4,235 |
| 🇹🇼 Taiwan | Asia | 3,789 |
| 🇹🇷 Turkey | Asia | 3,722 |
| 🇮🇶 Iraq | Asia | 3,532 |
| 🇮🇱 Israel | Asia | 3,460 |
| 🇸🇬 Singapore | Asia | 2,571 |
| 🇦🇫 Afghanistan | Asia | 2,547 |
| 🇪🇬 Egypt | Africa | 2,334 |
| 🇮🇹 Italy | Europe | 2,281 |
| 🇲🇦 Morocco | Africa | 2,281 |
| 🇳🇴 Norway | Europe | 2,196 |
| 🇳🇱 Netherlands | Europe | 2,060 |
| 🇰🇼 Kuwait | Asia | 1,900 |
| 🇨🇦 Canada | Americas | 1,806 |
| 🇵🇰 Pakistan | Asia | 1,070 |
| 🇮🇩 Indonesia | Asia | 982 |
| 🇲🇽 Mexico | Americas | 782 |
| 🇴🇲 Oman | Asia | 779 |
| 🇯🇴 Jordan | Asia | 675 |
| 🇩🇰 Denmark | Europe | 548 |
| 🇧🇷 Brazil | Americas | 510 |
| 🇸🇪 Sweden | Europe | 505 |
| 🇨🇴 Colombia | Americas | 472 |
| 🇵🇭 Philippines | Asia | 450 |
| 🇫🇷 France | Europe | 438 |
| 🇫🇮 Finland | Europe | 389 |
| 🇬🇷 Greece | Europe | 359 |
| 🇱🇧 Lebanon | Asia | 350 |
| 🇹🇭 Thailand | Asia | 342 |
| 🇵🇱 Poland | Europe | 336 |
| 🇨🇱 Chile | Americas | 335 |
| 🇪🇸 Spain | Europe | 292 |
| 🇷🇴 Romania | Europe | 275 |
| 🇹🇳 Tunisia | Africa | 251 |
| 🇩🇪 Germany | Europe | 221 |
| 🇧🇭 Bahrain | Asia | 187 |
| 🇵🇹 Portugal | Europe | 179 |
| 🇳🇬 Nigeria | Africa | 154 |
| 🇳🇿 New Zealand | Oceania | 150 |
| 🇧🇩 Bangladesh | Asia | 123 |
| 🇨🇭 Switzerland | Europe | 117 |
| 🇻🇳 Vietnam | Asia | 108 |
| 🇦🇷 Argentina | Americas | 103 |
The U.S. remains the biggest global exporter of weapons globally, however, sales of military equipment to foreign countries dipped by 21% over the previous fiscal year, dropping from $175 billion in 2020 to $138 billion in 2021.
Biggest Recipients of Russian Armaments
Russia, the world’s second-largest arms dealer, was responsible for 22% of global arms exports between 2011 and 2021.
In terms of TIVs, India remains the biggest importer of Russian weapons by a wide margin. India’s dependency on Russian-made arms is driven by its fight to quell the military assertiveness of China on one side and its constant skirmishes along the Pakistani border on the other.
But despite the continued support of Russia and its President by the Indian Prime Minister, even in the wake of Russia’s war on Ukraine, some reports have shown that India has been looking elsewhere for arms in the last few years.
Let’s take a look at some of the other biggest importers of Russian arms around the world:
| Russian Arms Transfer Recipient | Continent | TIV (Millions) |
|---|---|---|
| 🇮🇳 India | Asia | 22,869 |
| 🇨🇳 China | Asia | 9,419 |
| 🇩🇿 Algeria | Africa | 7,235 |
| 🇻🇳 Vietnam | Asia | 5,554 |
| 🇪🇬 Egypt | Africa | 3,998 |
| 🇮🇶 Iraq | Asia | 2,015 |
| 🇦🇿 Azerbaijan | Asia | 1,967 |
| 🇰🇿 Kazakhstan | Asia | 1,841 |
| 🇻🇪 Venezuela | Americas | 1,743 |
| 🇸🇾 Syria | Asia | 1,729 |
| 🇧🇾 Belarus | Europe | 1,190 |
| 🇲🇲 Myanmar | Asia | 856 |
| 🇺🇬 Uganda | Africa | 611 |
| 🇦🇪 UAE | Asia | 578 |
| 🇦🇴 Angola | Africa | 501 |
| 🇮🇩 Indonesia | Asia | 490 |
| 🇮🇷 Iran | Asia | 476 |
| 🇧🇩 Bangladesh | Asia | 454 |
| 🇦🇫 Afghanistan | Asia | 441 |
| 🇵🇰 Pakistan | Asia | 437 |
| 🇦🇲 Armenia | Asia | 373 |
| 🇹🇷 Turkey | Asia | 344 |
| 🇹🇲 Turkmenistan | Asia | 307 |
| 🇷🇸 Serbia | Europe | 296 |
| 🇳🇬 Nigeria | Africa | 249 |
| 🇸🇩 Sudan | Africa | 244 |
| 🇵🇪 Peru | Americas | 221 |
| 🇯🇴 Jordan | Asia | 204 |
| 🇲🇳 Mongolia | Asia | 171 |
| 🇺🇿 Uzbekistan | Asia | 156 |
| 🇳🇮 Nicaragua | Americas | 121 |
| 🇱🇦 Laos | Asia | 118 |
| 🇰🇼 Kuwait | Asia | 113 |
| 🇧🇷 Brazil | Americas | 98 |
| 🇸🇸 South Sudan | Africa | 82 |
| 🇲🇱 Mali | Africa | 73 |
| 🇪🇹 Ethiopia | Africa | 69 |
| 🇹🇭 Thailand | Asia | 68 |
| 🇿🇦South Africa | Africa | 50 |
| 🇨🇲 Cameroon | Africa | 45 |
| 🇰🇬 Kyrgyzstan | Asia | 41 |
| 🇷🇼 Rwanda | Africa | 41 |
| 🇶🇦 Qatar | Asia | 40 |
| 🇱🇾 Libya | Africa | 36 |
| 🇧🇭 Bahrain | Asia | 31 |
| 🇹🇯 Tajikistan | Asia | 30 |
| 🇨🇾 Cyprus | Asia | 28 |
| 🇨🇬 Republic of the Congo | Africa | 27 |
| 🇬🇭 Ghana | Africa | 27 |
| 🇺🇦 Ukraine Rebels | Europe | 24 |
One relationship of significance is Russia’s provided weapons to Pro-Russia Ukrainian Rebels. Since 2014, Russia has offered arms and training to these rebels in their fight. These have included weapons of all sorts, from pistols and mines to tanks and missile launchers.
Effect of the War on Ukraine on Arms Trades
According to the latest data from SIPRI, the international arms trade fell by 4.6% in the last five-year period. Despite this, Europe has become a new hotspot for arms imports, seeing a 19% increase in arms transfers over the same time period.
Countries like the U.K., Netherlands, and Norway were the largest importers, and other countries might follow suit.
Experts claim that this upsurge is attributed to the crumbling relationship between Russia and Europe. Alarmed by Russia’s invasion of Ukraine, European countries have been reevaluating their defense budgets—as exemplified by Germany’s recent €100 billion commitment to boost its military strength.
In the coming years, the U.S. and Russia’s biggest arms transfer partners are likely to shift. But which way will arms transfers trend?

This article was published as a part of Visual Capitalist's Creator Program, which features data-driven visuals from some of our favorite Creators around the world.


China
Which Countries Have the Most Economic Influence in Southeast Asia?
One country dominates this survey of who has the most economic influence in the region.
Countries With the Most Economic Influence in Southeast Asia
This was originally posted on our Voronoi app. Download the app for free on iOS or Android and discover incredible data-driven charts from a variety of trusted sources.
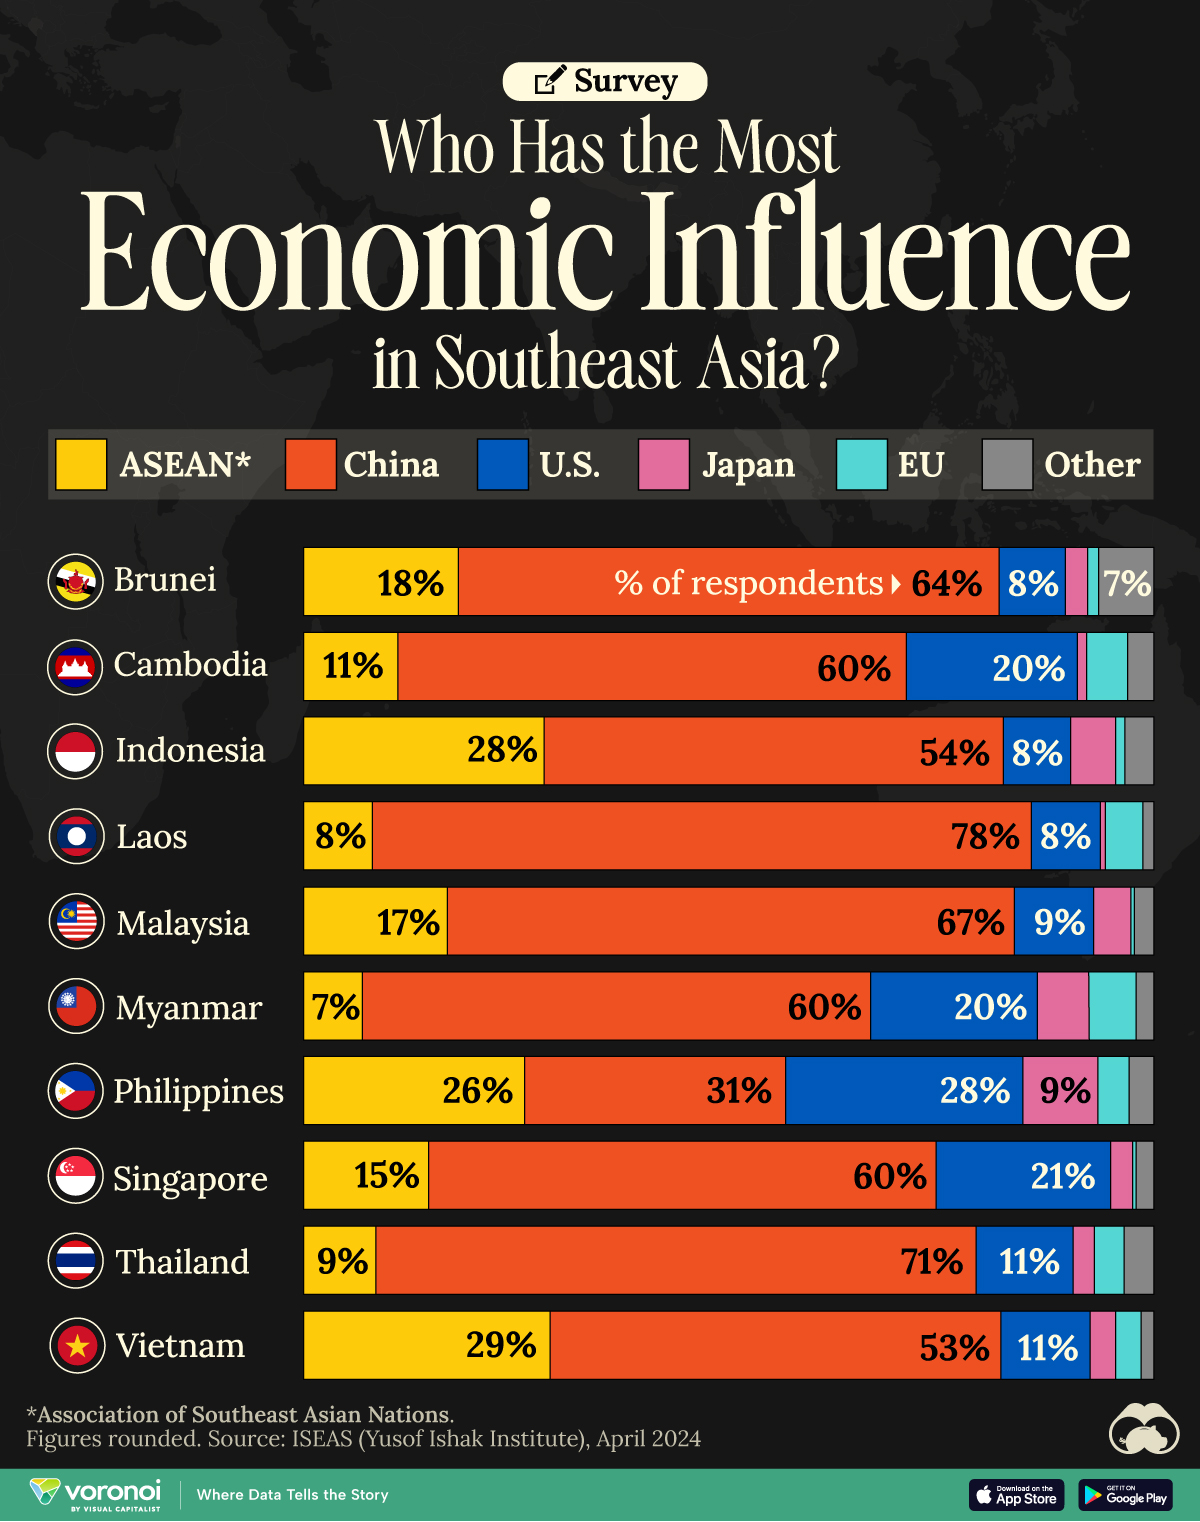
This chart visualizes the results of a 2024 survey conducted by the ASEAN Studies Centre at the ISEAS-Yusof Ishak Institute.
Nearly 2,000 respondents from 10 countries were asked to select which country/region they believe has the most influential economic power in Southeast Asia.
The countries surveyed are all member states of the Association of Southeast Asian Nations (ASEAN), a political and economic union of 10 countries in Southeast Asia.
Southeast Asia Perceptions: Who’s Got Economic Influence?
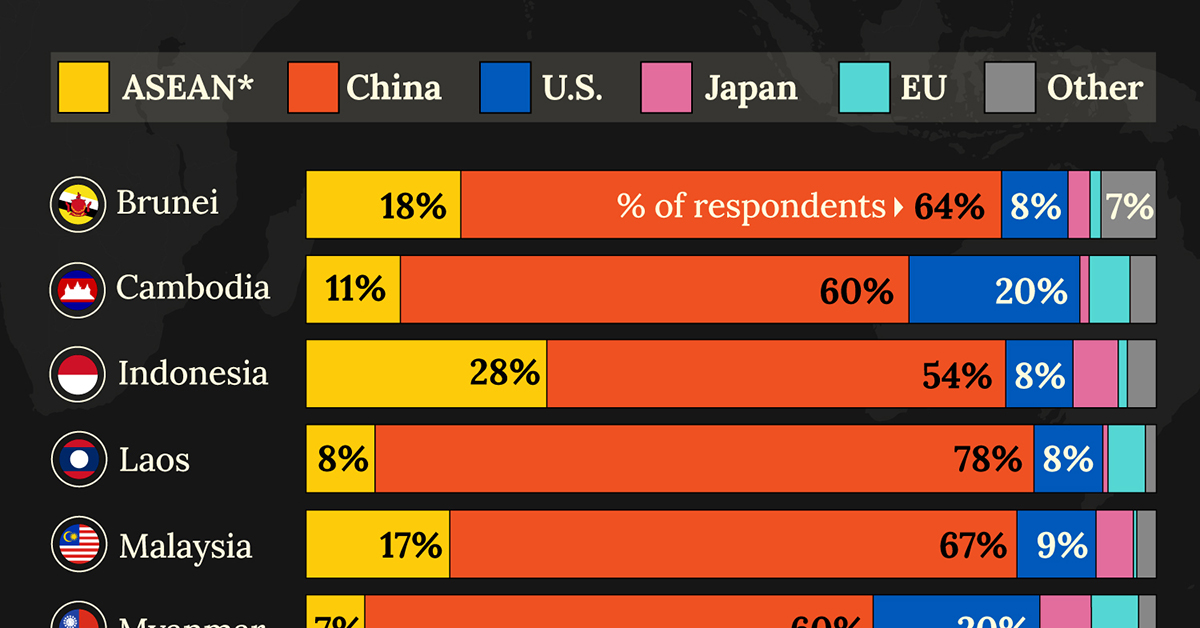
Across all ASEAN nations, China is regarded as the region’s most influential economic power.
Laos and Thailand had the highest share of respondents picking China, at 78% and 71% respectively. As the report points out, China is Laos’ largest foreign investor as well as its top export market.
| Country | 🇨🇳 China | 🌏 ASEAN | 🇺🇸 U.S. |
|---|---|---|---|
| 🇧🇳 Brunei | 64% | 18% | 8% |
| 🇰🇭 Cambodia | 60% | 11% | 20% |
| 🇮🇩 Indonesia | 54% | 28% | 8% |
| 🇱🇦 Laos | 78% | 8% | 8% |
| 🇲🇾 Malaysia | 67% | 17% | 9% |
| 🇲🇲 Myanmar | 60% | 7% | 20% |
| 🇵🇭 Philippines | 31% | 26% | 28% |
| 🇸🇬 Singapore | 60% | 15% | 21% |
| 🇹🇭 Thailand | 71% | 9% | 11% |
| 🇻🇳 Vietnam | 53% | 29% | 11% |
Note: Percentages are rounded.
Other ASEAN countries usually score highly as well, along with the United States.
It’s only in the Philippines, where China (31%), the U.S. (28%) and ASEAN (26%) were perceived as having a similar amount of influence.
ASEAN, Japan, and the EU
Filipinos also rated Japan’s economic influence the highest (9%) compared to those surveyed in other ASEAN countries. In 2023, the Southeast Asian bloc celebrated 50 years of friendship with Japan, marking it as one of their most important “dialogue partners.”
| Country | 🇯🇵 Japan | 🇪🇺 EU | 🌐 Other |
|---|---|---|---|
| 🇧🇳 Brunei | 3% | 1% | 7% |
| 🇰🇭 Cambodia | 1% | 5% | 3% |
| 🇮🇩 Indonesia | 5% | 1% | 3% |
| 🇱🇦 Laos | 1% | 4% | 1% |
| 🇲🇾 Malaysia | 4% | 0% | 2% |
| 🇲🇲 Myanmar | 6% | 6% | 2% |
| 🇵🇭 Philippines | 9% | 4% | 3% |
| 🇸🇬 Singapore | 3% | 0% | 2% |
| 🇹🇭 Thailand | 3% | 4% | 4% |
| 🇻🇳 Vietnam | 3% | 3% | 2% |
Note: Percentages are rounded. Other countries include: Australia, South Korea, India, and the UK.
The EU also received single-percentage responses, its highest share coming from Myanmar (6%), Cambodia (5%), and Laos (4%).
Finally, the report contrasted China’s robust economic influence with concerns about its growing impact in the region. Respondents from Vietnam (88%), Myanmar (88%), and Thailand (80%) had the highest levels of concern, despite their countries’ strong trade ties with China.

-

 Maps2 weeks ago
Mapped: U.S. Immigrants by Region
-

 population1 week ago
Mapped: U.S. States By Number of Cities Over 250,000 Residents
-

 Brands1 week ago
Charted: How the Logos of Select Fashion Brands Have Evolved
-

 United States1 week ago
Mapped: Countries Where Recreational Cannabis is Legal
-

 War1 week ago
Visualized: Aircraft Carriers by Country
-

 Brands1 week ago
How Popular Snack Brand Logos Have Changed
-

 Mining1 week ago
Visualizing Copper Production by Country in 2023
-

 Misc2 weeks ago
Charted: How Americans Feel About Federal Government Agencies