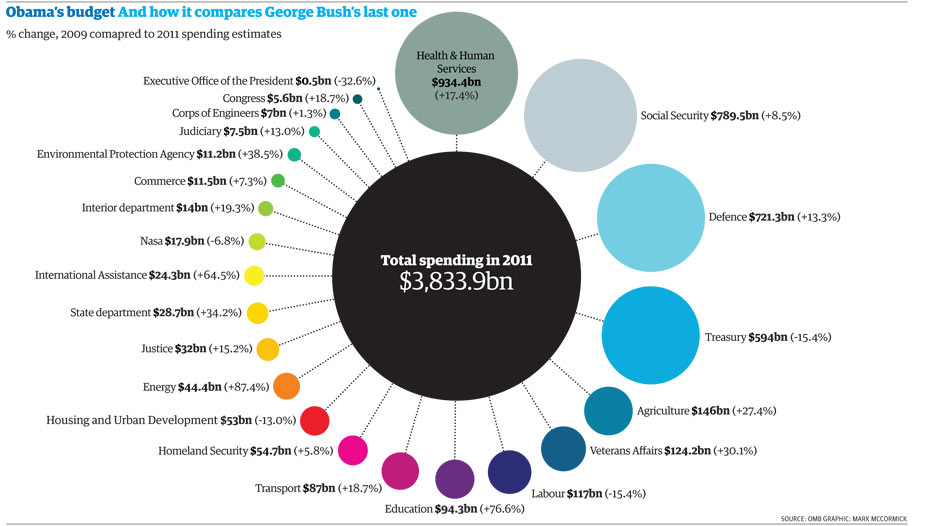

Obama's 2011 budget: click on image to see at full size
After a while they just appear to be unimaginably big numbers. By early 2011, the US government will have spent $3.8 trillion in one year.
President Barack Obama projected the US budget deficit would peak at a new record in 2010 - before easing as he pushes for fiscal responsibility while battling double-digit unemployment. "We won't be able to bring down this deficit overnight, given that the recovery is still taking hold," Obama said, laying out $3.8 trillion in spending plans for the fiscal year to end of September, 2011.
It's not set in stone - Congress has the power to change it. It also forcasts a $1.56 trillion deficit in 2010. That's or 10.6% of the economy measured by gross domestic product (GDP). This funding gap was forecast to dip to $1.27 trillion in 2011, or 8.3 percent of GDP, and fall to roughly half that as a share of the economy in the final year of Obama's term in 2012, meeting a key pledge.
So what does that mean for US public spending - besides cuts for Nasa? We've extracted the key figures from the White House Office of Management and Budget. It shows spending by department back to 1962 - and ahead to 2015. The summary is below but click on the spreadsheet link for the full data.
We've worked out the changes since bush's last budget - the 2009 figures. What can you do with it?
• DATA: download the full datasheet, 1962-2015
World government data
• Search the world's government with our gateway
Can you do something with this data?
Flickr Please post your visualisations and mash-ups on our Flickr group or mail us at datastore@guardian.co.uk
• Get the A-Z of data
• More at the Datastore directory
• Follow us on Twitter
Data summary
US budget - Obama compared to Bush
Figures in $m. Click headings to sort
|
Department
|
2009, $m
|
2010 estimate, $m
|
2011 estimate, $m
|
2011 % of spending
|
% change, Bush 2009 to Obama 2011
|
% change, 2010 to 2011
|
|
|
| Legislative Branch |
4,702 |
5,423 |
5,579 |
0.1 |
18.7 |
2.9 |
| The Judiciary |
6,645 |
7,159 |
7,512 |
0.2 |
13.0 |
4.9 |
| Agriculture |
114,440 |
142,016 |
145,748 |
3.8 |
27.4 |
2.6 |
| Commerce |
10,718 |
16,714 |
11,500 |
0.3 |
7.3 |
-31.2 |
| Defense—Military |
636,775 |
692,031 |
721,285 |
18.8 |
13.3 |
4.2 |
| Education |
53,389 |
106,944 |
94,261 |
2.5 |
76.6 |
-11.9 |
| Energy |
23,683 |
38,278 |
44,390 |
1.2 |
87.4 |
16.0 |
| Health and Human Services |
796,267 |
868,762 |
934,426 |
24.4 |
17.4 |
7.6 |
| Homeland Security |
51,725 |
52,903 |
54,723 |
1.4 |
5.8 |
3.4 |
| Housing and Urban Development |
61,019 |
62,518 |
53,082 |
1.4 |
-13.0 |
-15.1 |
| Interior |
11,775 |
12,042 |
14,045 |
0.4 |
19.3 |
16.6 |
| Justice |
27,711 |
30,333 |
31,924 |
0.8 |
15.2 |
5.2 |
| Labor |
138,157 |
209,265 |
116,902 |
3 |
-15.4 |
-44.1 |
| State |
21,427 |
25,726 |
28,745 |
0.7 |
34.2 |
11.7 |
| Transportation |
73,004 |
90,944 |
86,665 |
2.3 |
18.7 |
-4.7 |
| Treasury |
701,775 |
502,980 |
593,550 |
15.5 |
-15.4 |
18.0 |
| Veterans Affairs |
95,457 |
124,565 |
124,215 |
3.2 |
30.1 |
-0.3 |
| Corps of Engineers |
6,842 |
10,536 |
6,929 |
0.2 |
1.3 |
-34.2 |
| Other Defense—Civil Programs |
57,276 |
54,317 |
55,719 |
1.5 |
-2.7 |
2.6 |
| Environmental Protection Agency |
8,070 |
11,301 |
11,177 |
0.3 |
38.5 |
-1.1 |
| Executive Office of the President |
743 |
715 |
501 |
* |
-32.6 |
-29.9 |
| General Services Administration |
319 |
1,782 |
2,279 |
0.1 |
614.4 |
27.9 |
| International Assistance Programs |
14,797 |
23,899 |
24,343 |
0.6 |
64.5 |
1.9 |
| National Aeronautics and Space Administration |
19,168 |
19,123 |
17,863 |
0.5 |
-6.8 |
-6.6 |
| National Science Foundation |
5,958 |
7,819 |
7,647 |
0.2 |
28.3 |
-2.2 |
| Office of Personnel Management |
72,302 |
71,603 |
73,463 |
1.9 |
1.6 |
2.6 |
| Small Business Administration |
2,246 |
5,978 |
1,388 |
|
-38.2 |
-76.8 |
| Social Security Administration (On-budget) |
78,657 |
85,108 |
80,933 |
2.1 |
2.9 |
-4.9 |
| Social Security Administration (Off-budget) |
648,892 |
683,867 |
708,620 |
18.5 |
9.2 |
3.6 |
| Other Independent Agencies (On-budget) |
47,635 |
2,001 |
31,832 |
0.8 |
-33.2 |
1490.8 |
| Other Independent Agencies (Off-budget) |
304 |
6,426 |
4,226 |
0.1 |
1290.1 |
-34.2 |
| Allowances |
-4 |
18,750 |
21,676 |
0.6 |
542000 |
15.6 |
| Undistributed offsetting receipts |
-274,193 |
-271,127 |
-283,287 |
-7.4 |
-3.3 |
-4.5 |
| (On-budget) |
-142,013 |
-137,793 |
-148,634 |
-3.9 |
-4.7 |
-7.9 |
| (Off-budget) |
-132,180 |
-133,334 |
-134,653 |
-3.5 |
-1.9 |
-1.0 |
| Total spending |
3,517,681 |
3,720,701 |
3,833,861 |
|
9 |
3 |