
An Experimental Study on Rotor Aerodynamic Noise Control Based on Active Flap Control

National Key Laboratory of Rotorcraft Aeromechanics, Nanjing University of Aeronautics and Astronautics, Nanjing 210016, China
*
Author to whom correspondence should be addressed.
Aerospace 2023, 10(2), 121; https://doi.org/10.3390/aerospace10020121
Submission received: 20 November 2022
/
Revised: 12 January 2023
/
Accepted: 25 January 2023
/
Published: 27 January 2023
(This article belongs to the Special Issue Latest Advancements in Aeronautics and Astronautics: Celebrating the 70th Anniversary of Nanjing University of Aeronautics and Astronautics)
Abstract
:Reducing rotor aerodynamic noise is an important challenge in helicopter design. Active flap control (AFC) on rotors is an effective noise reduction method. It changes the segment airfoil shape, aerodynamic load distribution, and the wake path of the rotor flow by adding trailing edge flaps (TEFs). Although AFC noise reduction control is easily simulated, the relevant experiments have not been widely conducted due to test technical problems and limited financial support. The acoustic characteristics of the AFC-equipped rotor, such as the placement of TEFs for noise reduction and whether multiple winglets can provide a better effect than single winglets, have not been verified in previous experiments. In this work, an AFC-equipped rotor with two TEFs was designed, and its acoustic properties were tested in the FL-17 acoustic wind tunnel with microphone arrays in the far field. The results showed that the noise reduction effect of AFC was closely related to the control frequency and phase. Increasing the control phase could move the reduction region toward the azimuth-decreasing region for far-field noise. The noise reduction in a single outboard TEF was better than that in a single inboard TEF, while the dual-TEF model performed better. In this experiment, the average noise reduction in the observation point at the lower front of the rotor could be more than 3 dB, and the maximum noise reduction could be 6.2 dB.
1. Introduction
With their unique vertical take-off ability, small landing “footprint,” and hovering ability, helicopters play an essential role in transportation, medical rescue, agricultural plant protection, tourism, etc. Additionally, with the rapid development of science, technology, and the economy in China in recent decades, helicopters are more frequently used. However, the long-standing problem of rotor aerodynamic noise [1] has restricted the ways in which helicopters are used. Therefore, it is significant to explore effective rotor noise reduction technology.
Prior noise reduction methods principally explored passive designs, including the optimization of blade shape [2], torsional distribution [3], vortex generation [4], and some combined methods [5]. However, these passive methods cannot readily adapt to today’s increasingly complex work requirements. For this reason, recent research has focused more on active controls [6,7]. These include active flap control (AFC) technology [8], which has attracted considerable attention because of its simple drive mechanism, good noise reduction, vibration suppression [9], and power-saving features [10].
An AFC rotor is a rotor equipped with trailing edge flaps (TEFs) that can be deflected upward or downward, as shown in Figure 1. Theoretical research has included work by Sim showing that AFC as a force excitation source can reduce in-plane noise [11], and by Takashi, who explained the mechanism of controlling the blade vortex interaction (BVI) noise by controlling the blade interference distance [12]. In addition, many studies [13,14] observed that the two ends of the winglets would produce a strong vortex, leading to changes in the distribution of rotor load and showing the reason for increasing lift and reducing vibration. Li conducted a study on BVI noise reduction under non-harmonic control and found that such control can significantly reduce the intensity of the vortex. In numerical simulations, Friedmann found significant suppression of rotor BVI noise [15]. Noboru from the JAXA (Japan Aerospace Exploration Agency) also carried out rotor BVI noise closed-loop control based on multiple pressure sensors and achieved 5.7 dB noise reduction [16]. Lu’s experiment shows that in hovering and forward flight, noise can be reduced by 4 dB and 3 dB, respectively, while at the same time, the vibration of the rotor hub is reduced by 42% and 75%, respectively [17]. In terms of aerodynamic performance improvement, Michael and Edward applied active winglets and used spanwise arrays of fluidically oscillating jets on the leading edge of the winglets at the same time, making the maximum increase in airfoil optimization of up to 30% [18]. Zhao also used a similar control mode, and, by adding a jet to the leading edge of the blade, achieved a significant increase in the thrust coefficient of the rotor and a delay in the dynamic stall of the rotor [19]. Studying drive and control through experimental measurements, Dong observed that the control rate was not sensitive to changes in flight speed and pointed out that the same control transfer function could be applied in hovering and forward flight [20], which simplified controller design. At the same time, with the development of new materials and new structures, the piezoelectric material drives [21] and bionic muscle drive mechanisms [22] have also been developed, making AFC technology more mature. Based on these technologies, Eurocopter completed the flight of a BK117 helicopter equipped with TEFs [23]. NASA (National Aeronautics and Space Administration) and Boeing in the United States were involved in a SMART project that systematically tested a full-scale AFC rotor modified from an MD900 helicopter [24]. In addition, AFC can also be innovatively applied to wind turbines, reducing the equivalent damage load of the fan [25].
However, according to the published research, the existing tests rarely target aerodynamic noise suppression, and most of them have been focused on the observation of in-plane [11] and BVI noise [26]. They have not involved the radiation characteristics of the sound field around the rotor in detail. At the same time, the active control of double/multiple trailing edge winglets is also mainly focused on vibration reduction [27] and multiobjective optimization [28] but not yet sufficiently on the combined action of double/multiple winglets to suppress aerodynamic noise.
Therefore, based on previous numerical simulations [29,30], driving mechanism designs [31], and hovering tests of AFC rotors [32], the author and a cooperative team designed a new AFC rotor with dual TEFs. We tested this AFC rotor in a forward flight condition to check for noise reduction, in order to study the effect of AFC noise reduction under double winglets, to observe the propagation characteristics of the sound field in the region around the rotor under AFC control, and to look for a law governing noise reduction.
2. Experimental Principle and Scheme
2.1. The Principle of AFC Noise Reduction
According to the FW-H equation [33], the rotor noise perceived at the noise observation point can be expressed by
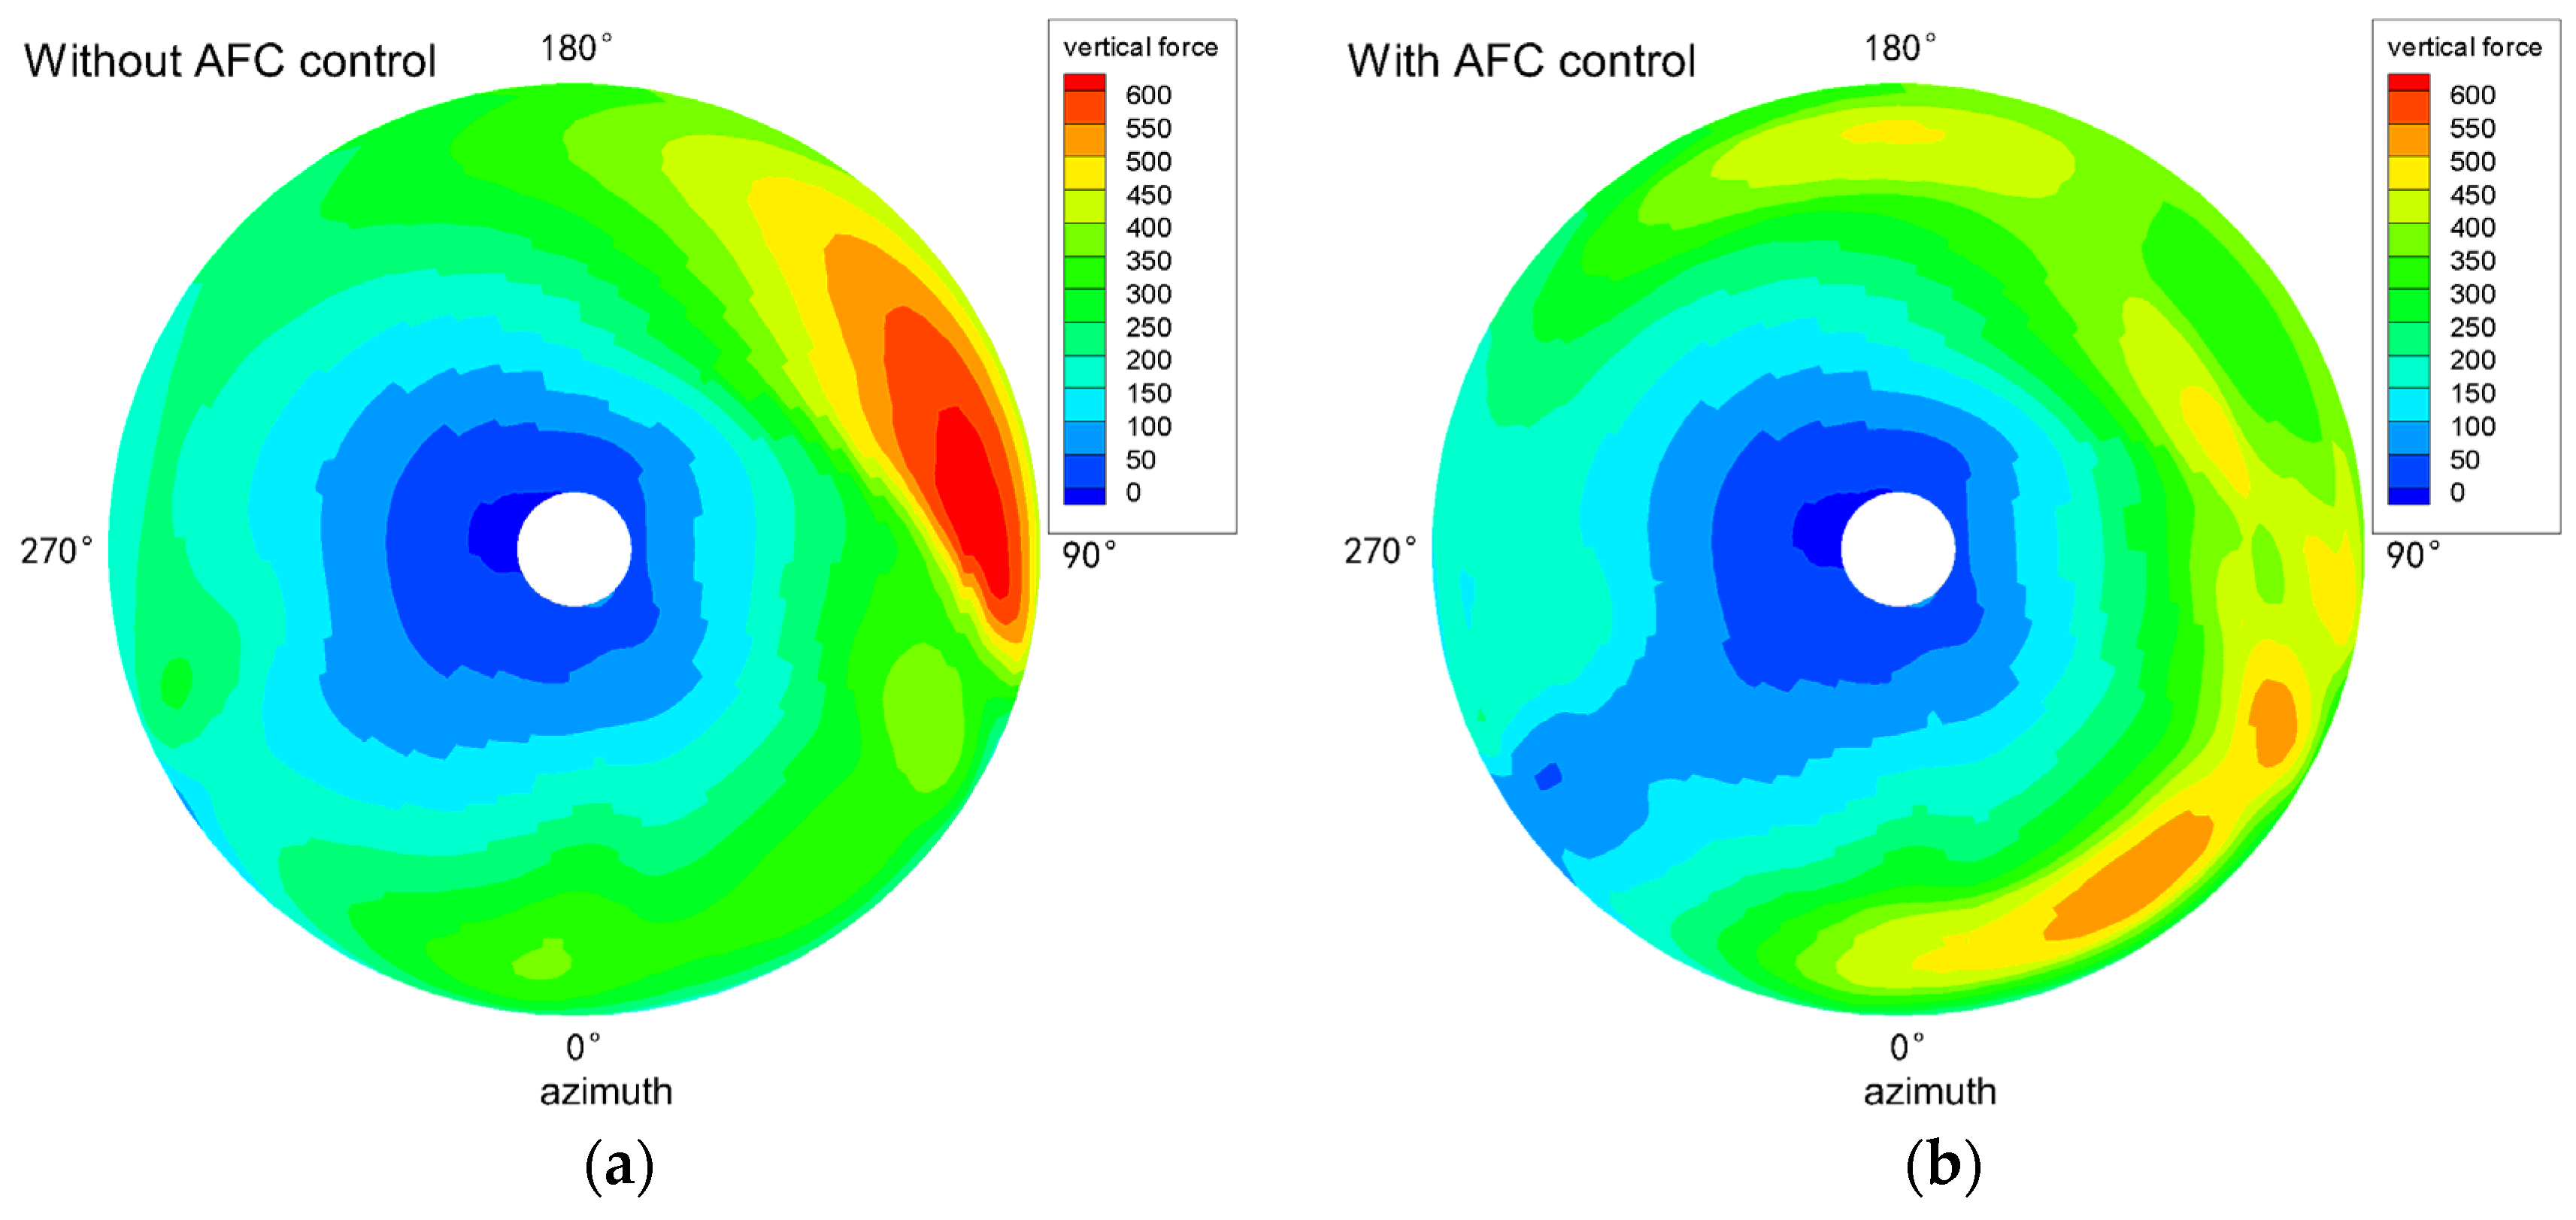
where is the D’ Alembertian operator, is the sound source surface, is the local normal velocity of the surface, is the surface pressure, is the disturbed sound pressure, and and are the sound velocity and the air density without disturbance, respectively. In Equation (1), the first term is the thickness noise, which corresponds to a monopole sound source, mainly generated by the displacement of air by the blade and dominant in the rotor rotation plane. The second term is the load noise, which corresponds to a dipole sound source and is closely related to the aerodynamic load (more specifically, related to the aerodynamic load fluctuation) and plays a significant role in the rotor noise radiation in other directions. The third term is the quadrupole sound source, which accounts for a relatively small subsonic flow field for a conventional rotor and can usually be ignored. It should be noted that the thickness noise is independent of the load noise. Therefore, based on this characteristic, the AFC can directly generate a force with a phase opposite to that of the thickness noise component and reduce the noise through cancellation. Its principle is shown in Figure 2. At present, it Is mainly used for noise reduction In the on-plane region. On the other hand, the AFC can change the rotor’s load distribution during the blade’s rotation through its own motion, which can reduce the rotor’s load rate of change and thereby achieve noise reduction. Figure 3 shows the load change in the rotor caused by the AFC, as found in the numerical simulation case (two rectangular blades, R = 1 m, 1200 RPM, advance ratio 0.24, and TEFs from 0.75R to 0.93R); it can be observed that it causes an obvious decrease in load fluctuation. In addition, corresponding to the BVI noise caused by load pulsation, the change in the velocity of the blade surface caused by vorticity can be expressed by [34]
where is the vorticity size, is the radius of the vortex core, and is the distance between the surface and the vortex core center.
In addition to directly changing the interference distance, the AFC can also change the blade bending moment by changing the load distribution when considering the elastic deformation of the actual blades. The bending moment of the blade can also be changed by changing the load distribution, thus increasing the vertical separation between the vortex and the blade and reducing the BVI noise. More detailed principles of noise reduction can also be found in the author’s previous study [30].
2.2. Test Platform and Scheme
Our test was carried out using a model rotor with a radius R = 1.5 m. Its blade airfoil was OA312, and its chord length was c = 130 mm. Its linear torsion varied along its length. It had a torsion angle of 10° at 0.25R and –2° at 0.933R, and it had a parabolic blade tip (taper ratio 1:3), shrinking from 0.941R, as shown in Figure 4a. The three blades were connected through a hingeless hub, as shown in Figure 4b, and the solidity was 0.1013. At the trailing edge of each blade, two independently controllable TEFs were installed; they were driven by a piezoelectric mechanism. Each TEF had a chord length of 0.154c and a span of 0.1R. The installation positions of the inboard and outboard TEFs were 0.737R and 0.85R (measured from the spanwise centers of the TEFs). The actual AFC blade is shown in Figure 4c. The skin was made of glass fiber, the actuator support frame was aluminum alloy, and the winglets were filled with composite materials, which can normally work under the design speed of 1320 rpm (Table 1).
The AFC control system in the test was designed by a cooperative team; the principle is shown in Figure 5. The deflection of the winglets was generated using the control system after receiving the pulse signal sent by the main engine, and the alternating sinusoidal voltage was output to the actuator through the power amplifier. The actuator could provide a maximum driving frequency of 60 Hz and had an independent closed-loop control system inside, which can make the deflection positively correlated with the input control voltage, with a linearity deviation of 0.1% [35], so the winglets also underwent sinusoidal deflection. In this test, the design deflection rule is associated with the rotor speed. The deflection angle of the TEF under control is expressed by
where is positive below the blade and negative above; is the TEF’s deflection angular frequency (usually an integral multiple of rotor angular frequency , ); and is the initial phase of the control signal.
In this test, the maximum deflection frequency was 80 Hz, and in the non-rotating condition, the amplitude was 6°. However, due to structural limitations, the AFC blade was not equipped with a deflection-angle-measuring device. Even if the driving mechanism has sufficient rigidity (801 N/m@120 V, which is larger than typical blade stiffness), the actual deflection amplitude under rotation cannot be accurately measured. Therefore, only maintaining a max voltage of 150 V in rotation and cases with different amplitudes were not tested.
The test was carried out in the FL-17 reflux acoustic wind tunnel (5.5 m × 4.0 m) of the China Aerodynamic Research and Development Center (CARDC). The rotor drive mechanism, aerodynamic measurement device, and noise data acquisition system are provided by the CARDC. The allowable rotor speed can reach 1400 rpm, the speed control error is less than 0.1%, the measuring accuracy of the rotor thrust is 0.10%, and the measuring accuracy of torque is 0.13%, which can ensure that the rotor is always in the same working state in the test. In this test, the control rotor speed was 808 rpm (the blade tip velocity was Mach 0.37), and the rotation direction was counterclockwise from above. The winglets installed on the trailing edge of the blades underwent controlled deflection motion while the rotor blades were rotating.
The test section of the wind tunnel was 14.0 m long. The background noise of the test section was 75.6 dB (measured at a wind speed of 80 m/s and a lateral distance of 7.95 m from the outlet center via the A-weighting process [36]). A fully anechoic chamber surrounded the wind tunnel test section (length 27 m × width 26 m × height 18 m), as shown in Figure 6a, which met the acoustic test requirements of ISO3745, ISO6798, and GB6882. The sensitivity of the microphone was 50 mV/Pa, the sampling frequency of the noise data acquisition system was 204 kHz, the accuracy was 0.1 dB, and the dynamic measurement range was more than 120 dB, which fully met the needs of noise measurement in the test. A rotor test bench was installed on the support mechanism of the acoustic wind tunnel, and the axis shaft angle could be changed using the support mechanism. This made it possible to achieve the different angles of attack of the incoming flow and to show the different flight states of the rotor, as shown in Figure 6b. The center of the hub on the test bench was 580 mm above the wind tunnel centerline and 4 m from the outlet of the wind tunnel.
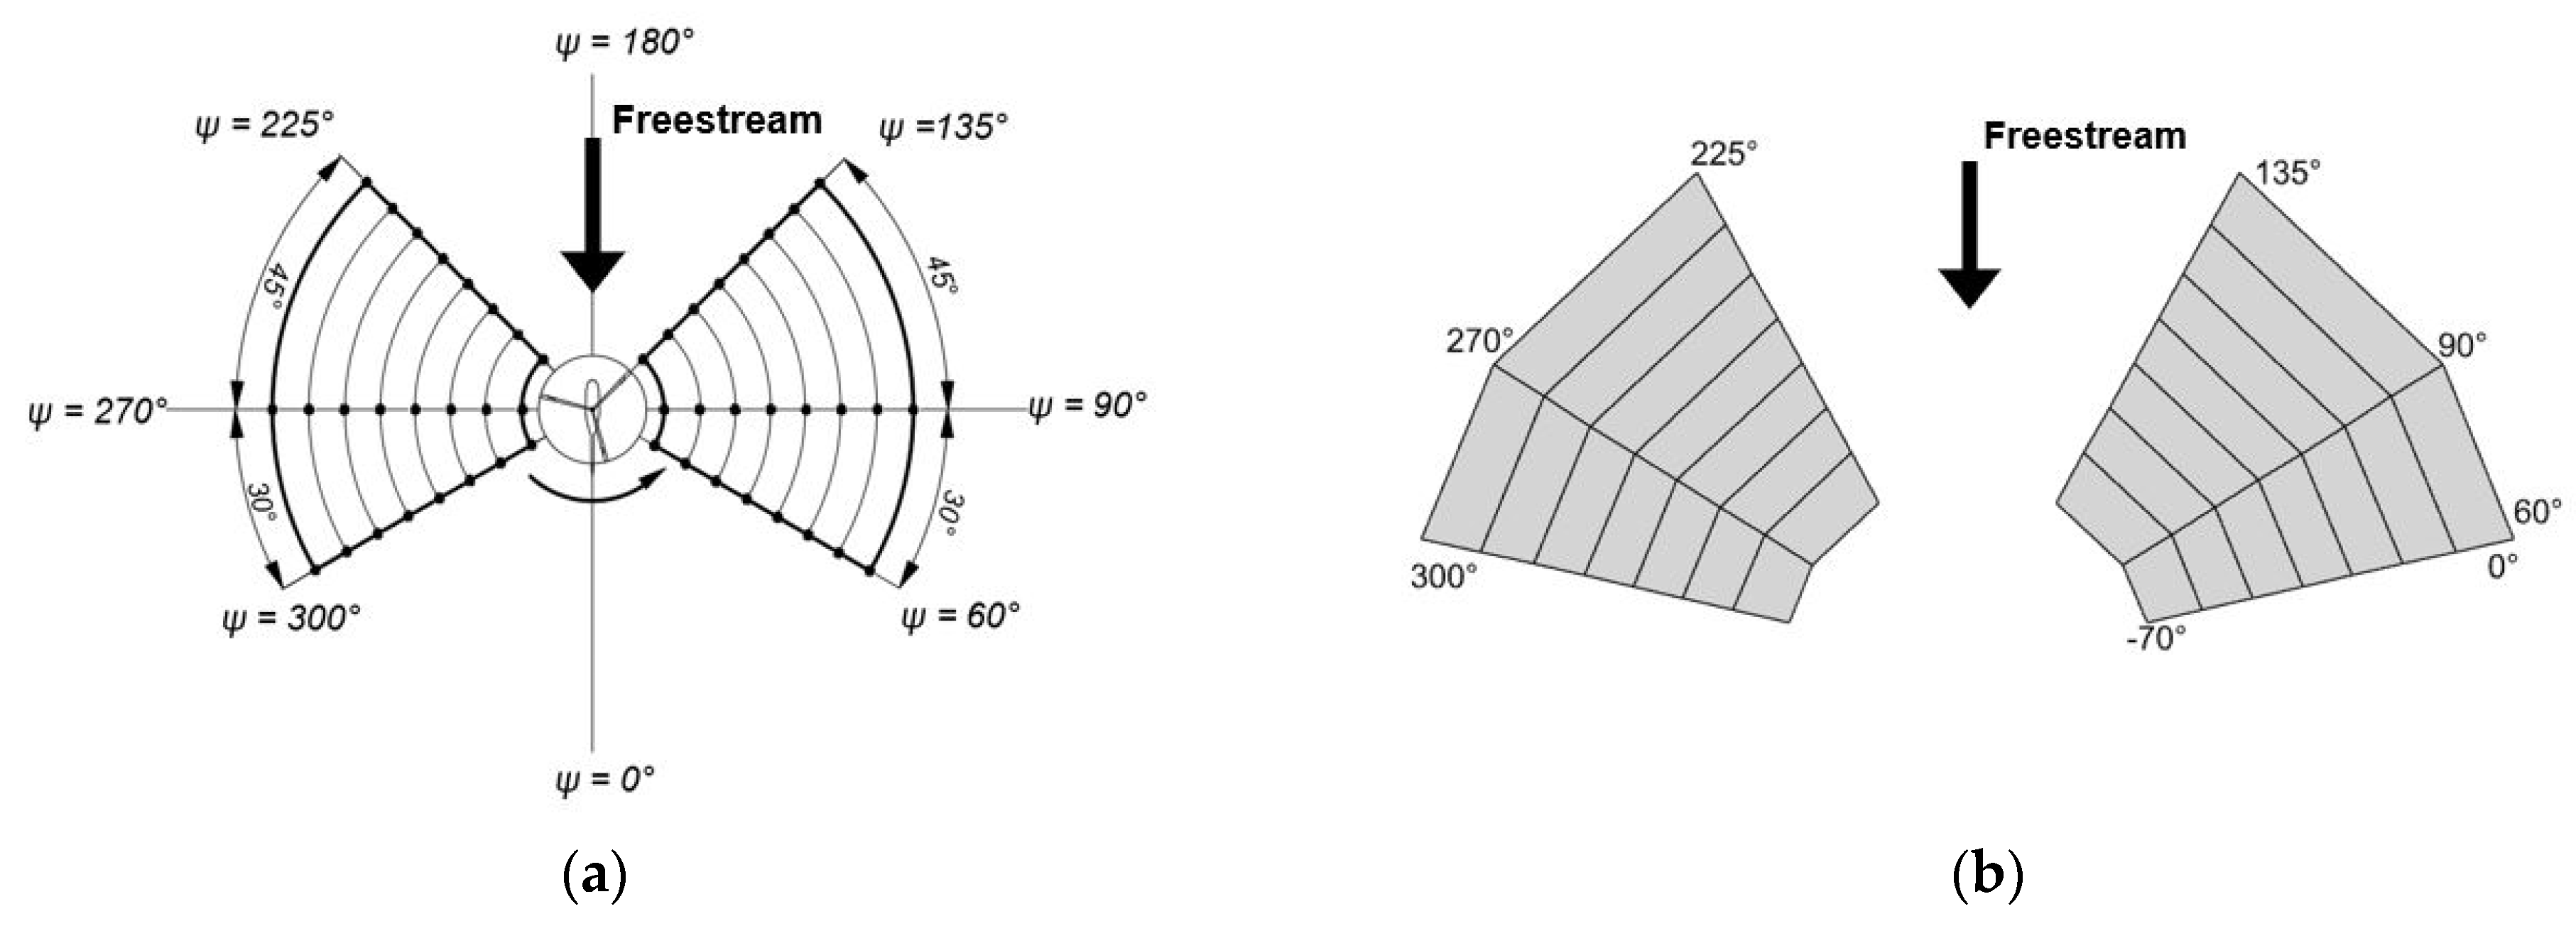
Two microphone arrays were used in this test. The first array was arranged on a V-shaped bracket below the front of the rotor. The arrangement of microphones on the bracket is shown in Figure 7a. The vertical distance from the horizontal section on this bracket to the rotor hub center was 4.3 m, and the horizontal distance was 3 m. In total, 8 microphones were arranged on the horizontal section, and 5 microphones were placed on the left and on the right bevel edge (18 microphones in total in this array). The second array was performed on the arc brackets around the rotor. There were six arc brackets with a radius of 6 m (4.0R). The center of the arc brackets coincided with the center of the rotor hub, and the range of depression angles was 0–70°. The microphones were installed every 10° on the arc brackets, and a total of 8 × 6 = 48 microphones were used in this array. The arc microphone array was set using six azimuth angles of the rotor: 60°, 90°, 135°, 225°, 270°, and 300°. Figure 7b shows the locations of the arc array’s microphones.
2.3. Processing and Verification of the Test Data
2.3.1. Acquisition and Processing of Test Data
In this test, the original 20 s of sound pressure was continuously recorded in each test state, and the 1 s results at the beginning and end of the recorded data were deleted. Thus, 18 s of data were retained for the signal data processing to ensure accuracy. Then, the fast Fourier transform (FFT) was used to transform the retained 18 s sound pressure data from the time domain to the frequency domain. In addition, considering that the sound pressure data recorded with a microphone arises from multiple sound sources (including the movement of the driving mechanism and vibration of the blade), it was necessary to filter the recorded signal to remove the part that was inconsistent with the aerodynamic noise characteristics.
In this work, a Chebyshev II filter [37] was used for signal filtering. The cut-off frequencies of the passband and stopband of the high-pass filtering part were set to 35 Hz and 30 Hz, respectively, and the cut-off frequencies of the passband and stopband of the low-pass filtering part were set to 3000 Hz and 8000 Hz, respectively. The passband ripple was 3 dB, and the stopband attenuation was 51 dB. Figure 8 shows the original sound pressure signal at Microphone 1 on the V-shaped bracket array and the sound pressure signal processed using the filter during descending flight. It can be seen from the comparison that the filter could remove the burr formed by the interference sound source and did significantly change the value and trend of sound pressure, nor did it prevent the model to meet the subsequent requirements for rotor noise characteristic analysis.
2.3.2. The Consistency of Repeated Tests
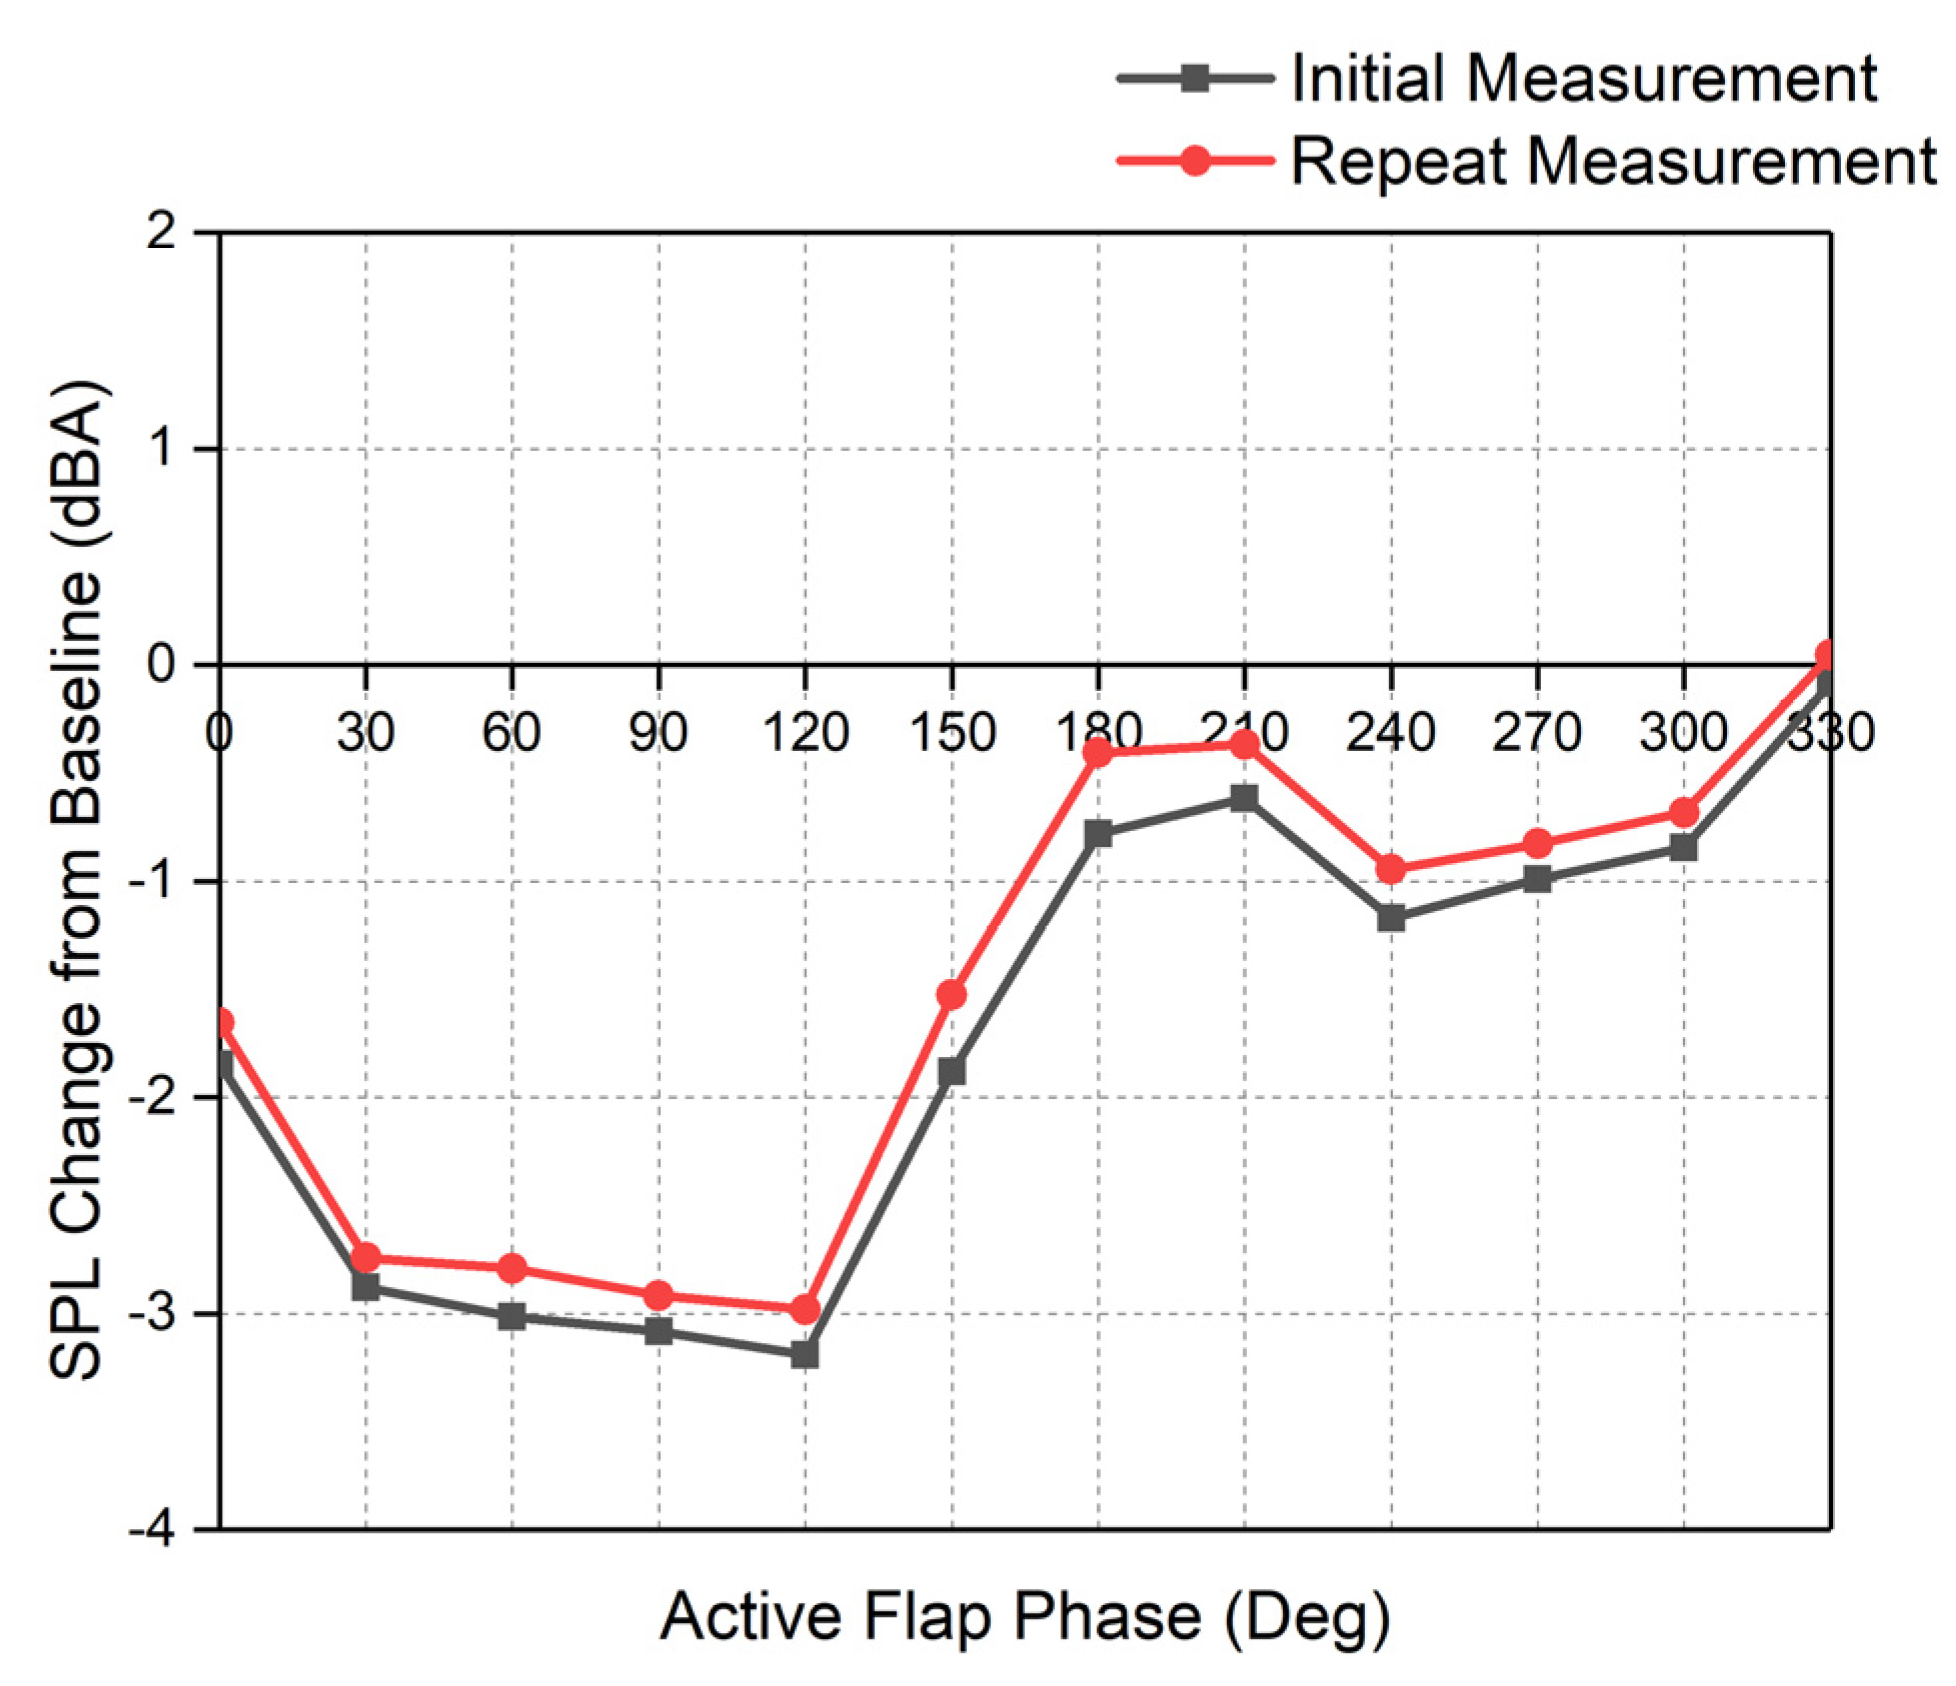
It should be noted that the test involved a large number of measurements over about two weeks, even though the facilities used in the tests described above had superior performance. Therefore, to detect whether this was due to fatigue failure or an impact of environmental changes (e.g., pressure and temperature) of the test rotor, repeated tests were conducted for a group of states at the control frequency of the TEF, 4ω (denoted 4P). Figure 10 shows a comparison of noise reductions for the two groups. It can be observed that the trend was consistent, and the difference between the noise reduction values was within 0.2 dB. Although there was a difference, the test still showed good reproducibility considering the difference in ratio with the final observed noise reduction value (typically ≥2 dB). Therefore, it can be assumed that the experimental device is reliable, and the test results are sufficiently accurate. In addition, since the rotor blades in the test were manually customized, there would inevitably be some differences in structural stiffness during processing. The noise observation results brought by the slight differences in the blade deformation were amplified in the special state test such as BVI. More detailed results of the relevant differences will be discussed in Section 3.4.
3. Results and Discussion
3.1. The Influence of Flight State
3.1.1. Hover Flight
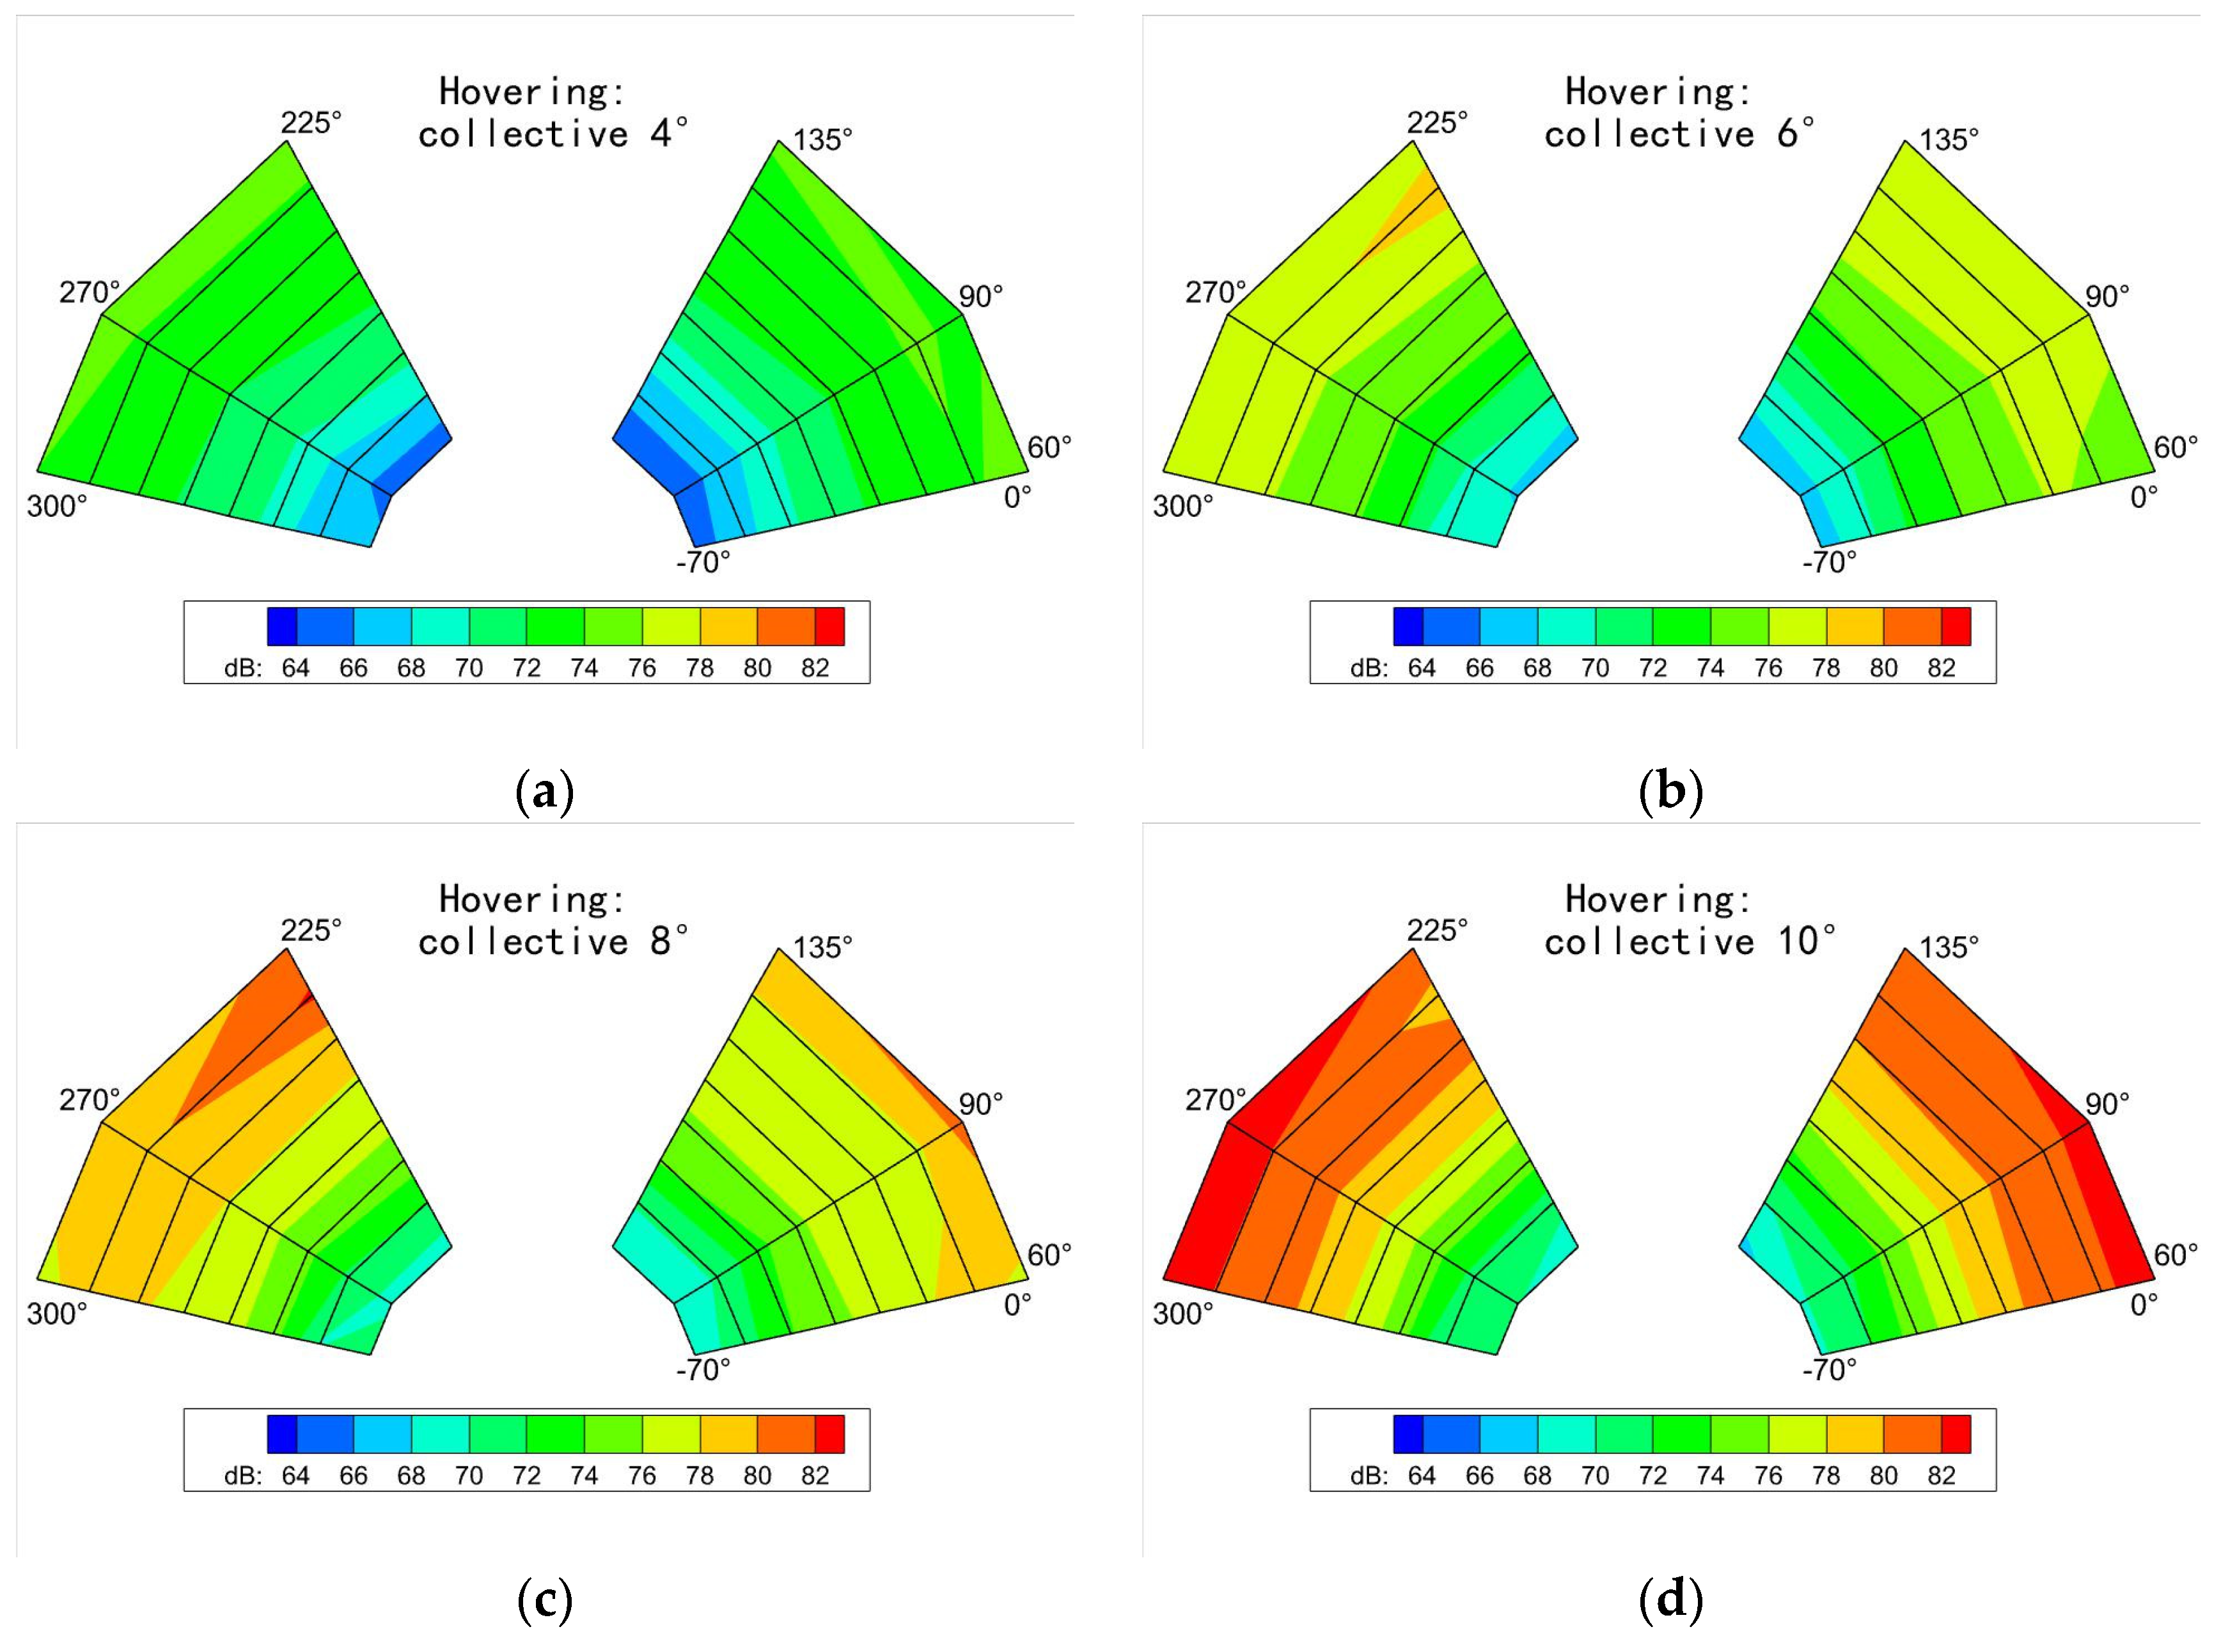
The results of hovering and non-AFC controlled flight are shown first to demonstrate the basic noise characteristics of the rotor. Figure 11 shows the noise measured using the arc bracket microphone array. It can be seen that during hovering, the noise generated by the rotor was mainly in-plane noise, and its maximum value in the rotor plane with noise sound pressure levels (SPLs) was almost the same at different azimuths. However, the noise gradually increased with an increase in the collective angle. It is worth noting that since the in-plane noise is related to the blade’s air discharge rate [38], the SPL and the total pitch angle had a linear increase relationship. Figure 12 shows the SPL change at 90° azimuth for different collective angles.
3.1.2. Forward Flight
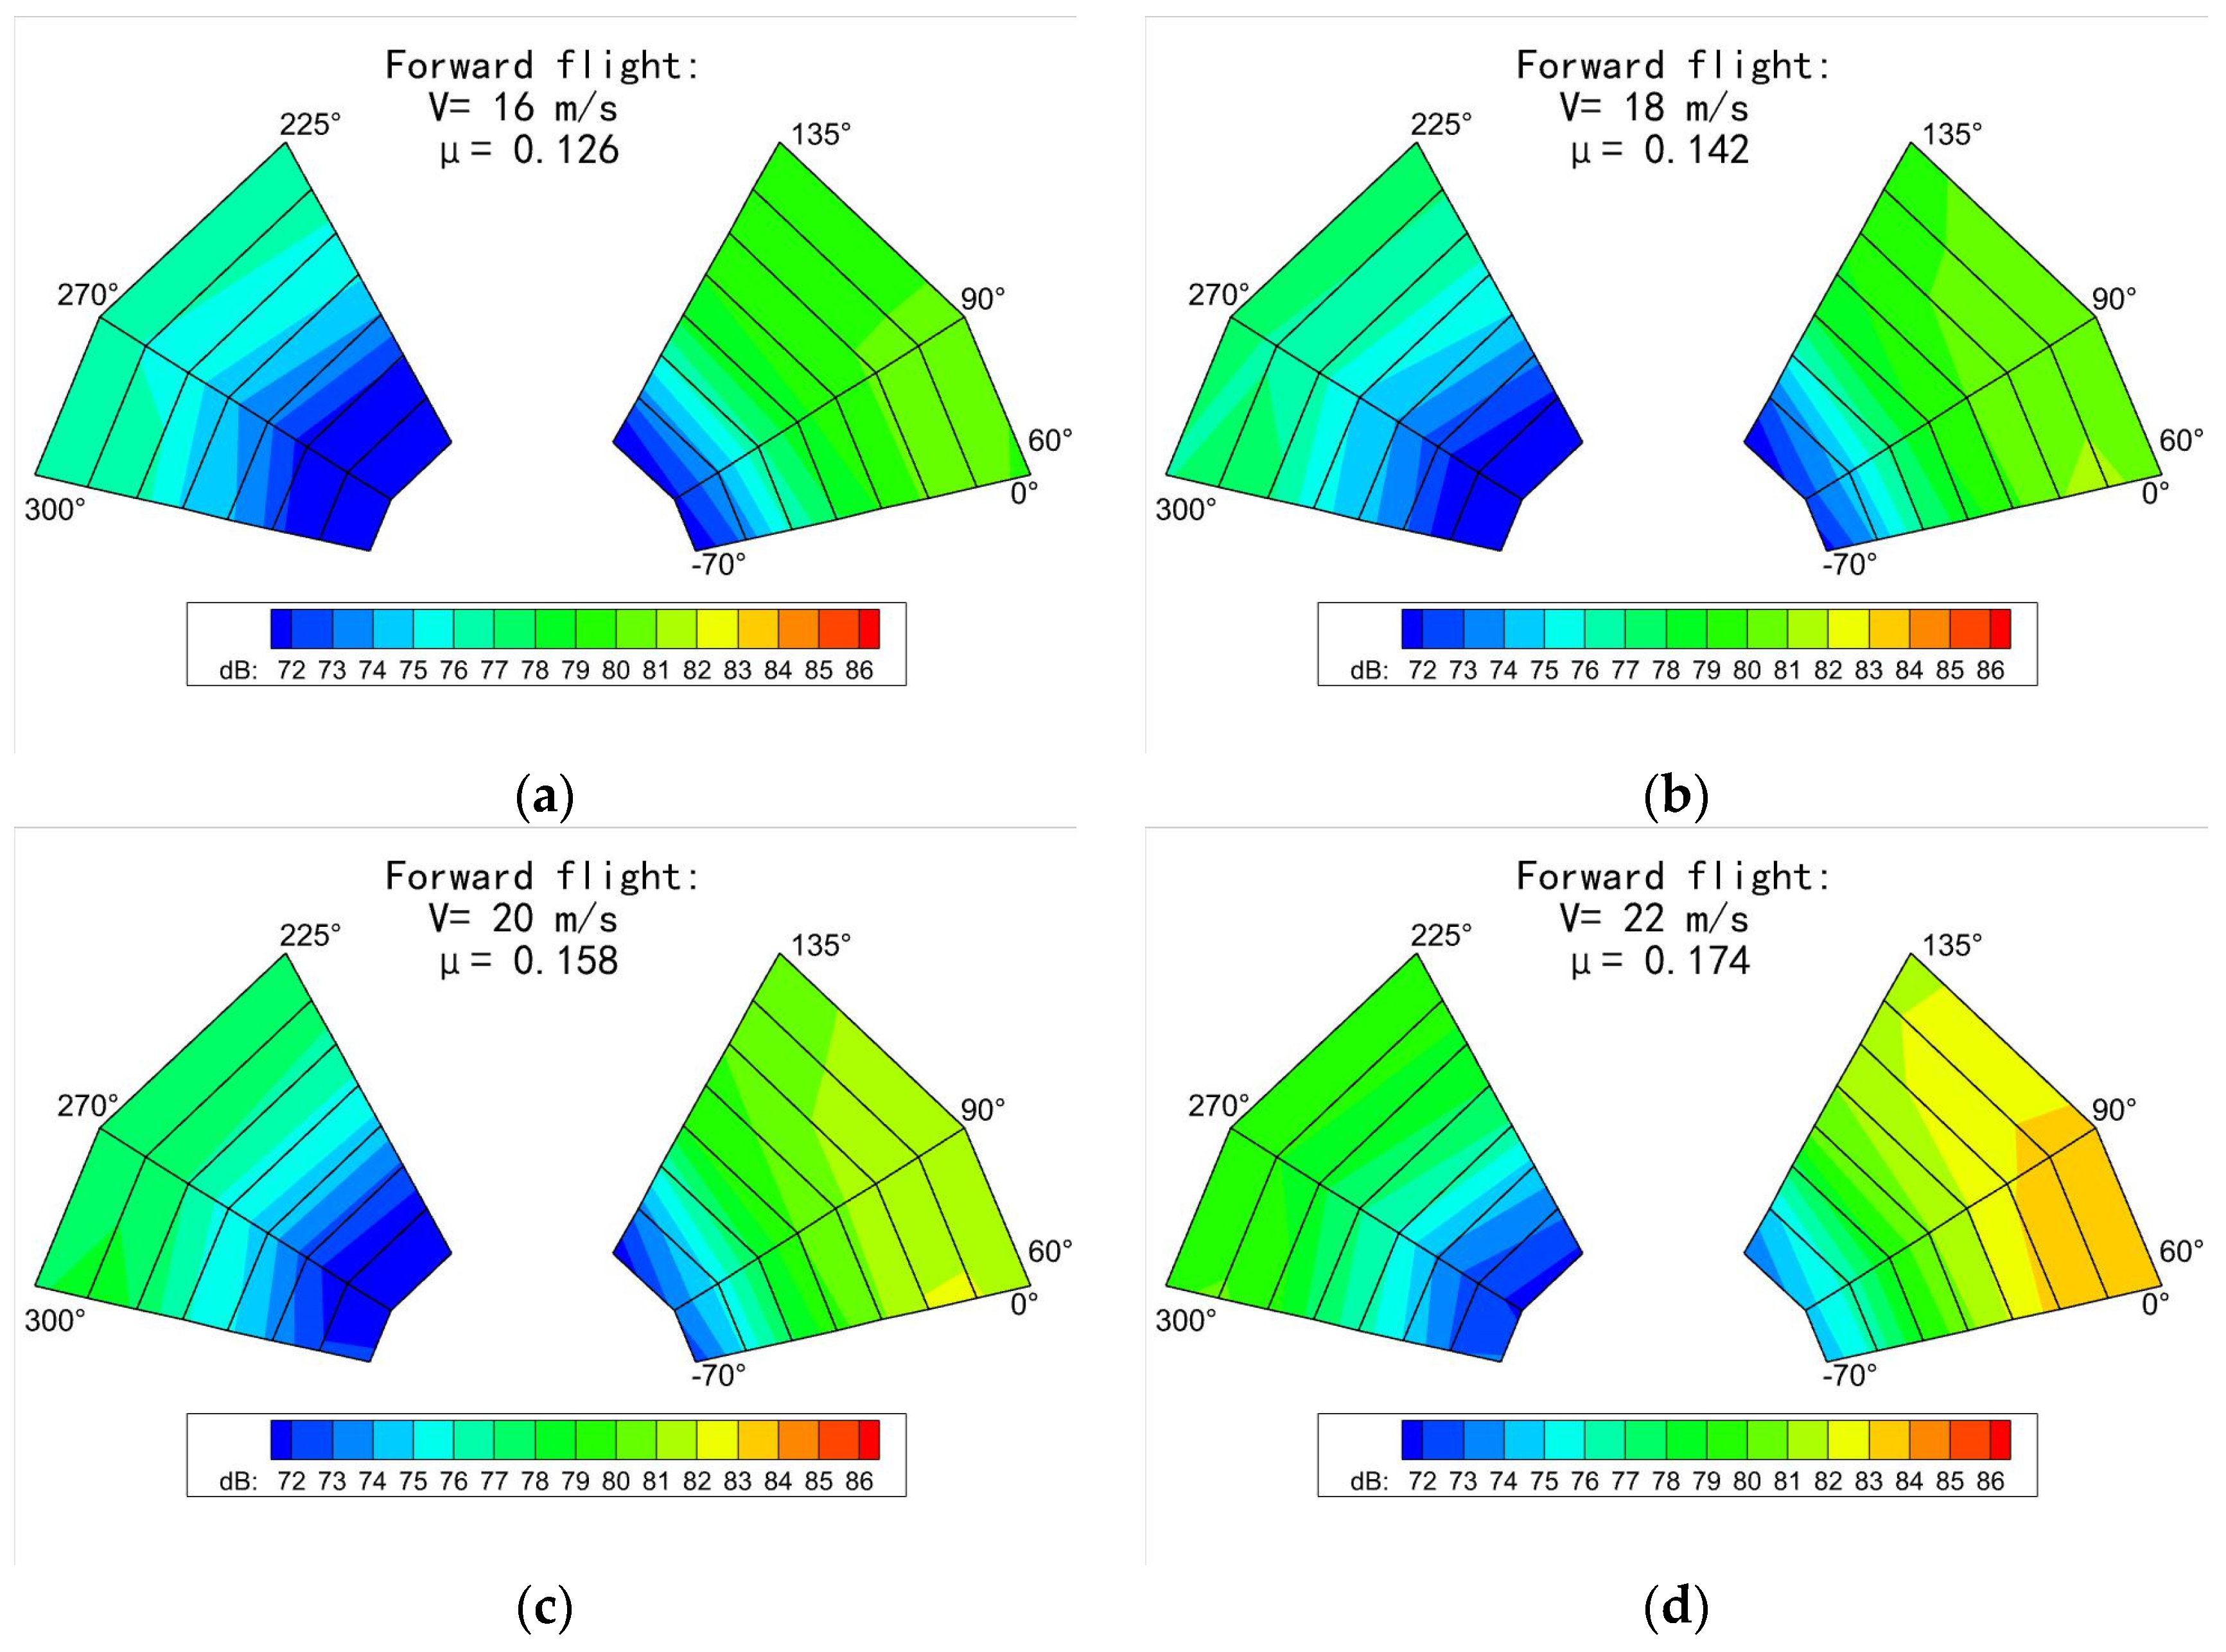
Figure 13 shows the noise distribution in forward flight (0° lean-back angle) without AFC control. Unlike hovering, although the in-plane noise is still very high, the sound pressure level is higher below the oblique region. On the other hand, since the relative inflow velocity on the advancing sides of the blades is greater than that on the retreating sides, the corresponding aerodynamic noise is also significantly greater there than that on the retreating sides, and the difference Is more pronounced at larger speeds.
Figure 14 shows the noise variation for 3P/240° at different inflow speeds. Although the distribution of noise change is slightly different, a noise reduction effect is found in most regions. Moreover, since the aerodynamic force generated by the winglets increased with the incoming flow velocity (advance ratio, ), the maximum noise reduction value increased. In other words, at this kind of medium speed, the noise reduction effect of AFC control increased with an increase in the rotor advance ratio.
3.1.3. Oblique Descent
Figure 15 shows the noise distribution of the rotor without AFC control when the lean-back angle changed from 2° to 6° at 19 m/s. This set of tests shows that the rotor descending rate became larger as the lean-back angle increased until more obvious BVI noise was generated. It can also be observed that the noise around the rotor increased with an increase in the lean-back angle. The change was more significant when the lean-back angle changed from 2° to 5°. However, in the case of extreme lean-back angles (such as 5° to 6°, when the BVI interference was removed from the most intense state), the noise changed more slowly. In general, as the lean-back angle increased, the in-plane noise increased. As in forward flight, the noise generated by the advancing side was greater than that generated by the retreating side.
Figure 16 shows the noise reduction condition under AFC control for oblique descent with different lean-back angles. The control frequency was 4P, and the vertical force coefficient of the rotor for 5° and 6° was 0.012, while for 7°, it was 0.015 (the difference being caused by the lean back of the rotor with the incoming flow velocity fixed). Under the control phase shown in the figure, the noise reduction effect is achieved over a wide range. Still, the maximum noise reduction value and regions were quite different for different control phases. In addition, the noise reduction at 6° was greater than at 5°. In the 7° state, the noise reduction at 60° was better than that at 6°, but the 90° control phase was worse. The possible reason is that when BVI occurred, the tip vortex approached the blade from different sides above and below, which made a difference in the noise reduction performance for the same control frequency and phase. In conclusion, the noise reduction condition during oblique descent increased as the lean-back angle (oblique descent) became larger in a certain range. Yet, at the same time, the noise reduction effect under the same control phase was also affected by the lean-back angle (oblique descent rate).
3.2. The Influence of the Control Law
3.2.1. Frequency
When hovering, the noise variations under the 0° phase and different control frequencies were analyzed, which are shown in Figure 17. It can be observed from the figure that the noise distribution at different frequencies was quite different—that is, the noise distribution under active control was directly affected by the deflection frequency. In this case, the noise at 2P was the largest; some regions even had an apparent noise increase. The noise for the other control frequencies was relatively small, and the noise reduction at 3P was the greatest. This is because the rotor had multiple blades, and when the order of the control frequency was a multiple of the number of blades, the aerodynamic change in the rotor was the same frequency as the controlling force of the winglets, and the effect was enhanced, although the maximum noise reduction control state needed a proper phase. A similar phenomenon of load fluctuation was also observed by Zhou [14].
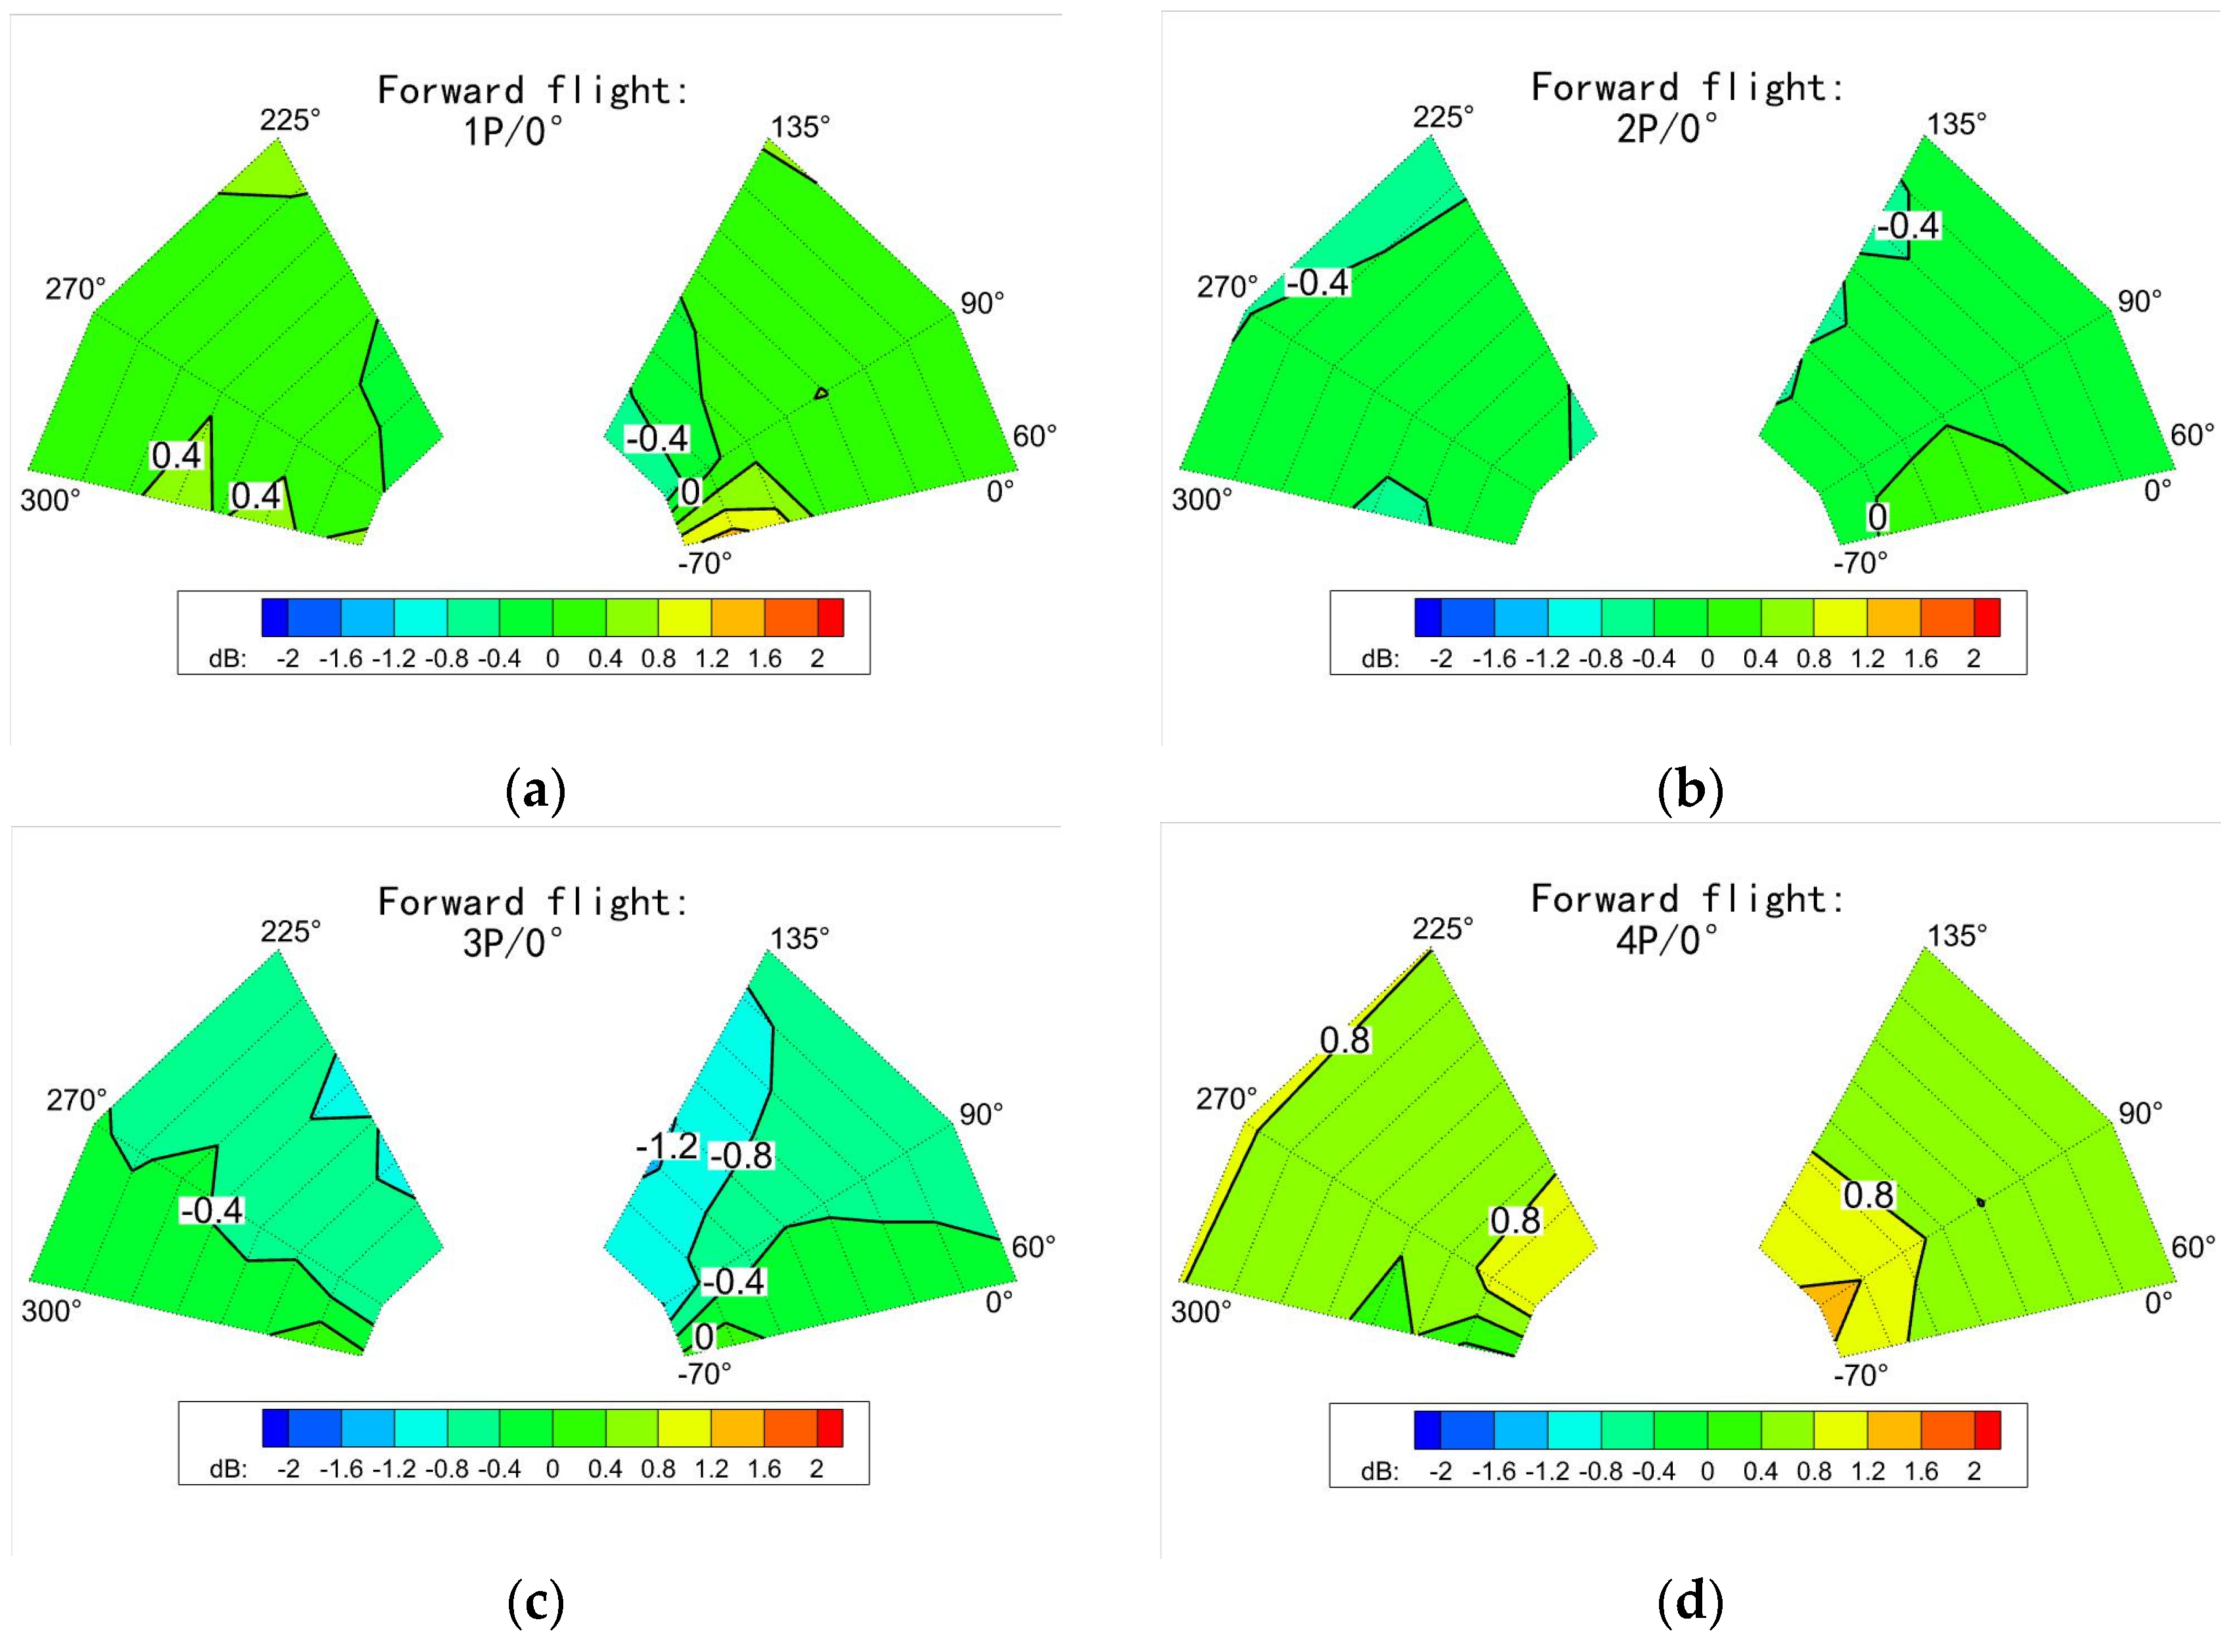
With the above control law maintained, the noise reduction result for the forward flight was similar to that for hovering, and the effect was stronger for 3P, as shown in Figure 18. However, unlike the hovering scenario, the noise reduction region was mainly concentrated in the area close to the incoming flow. When the frequency was 4P, no noticeable noise reduction region was observed.
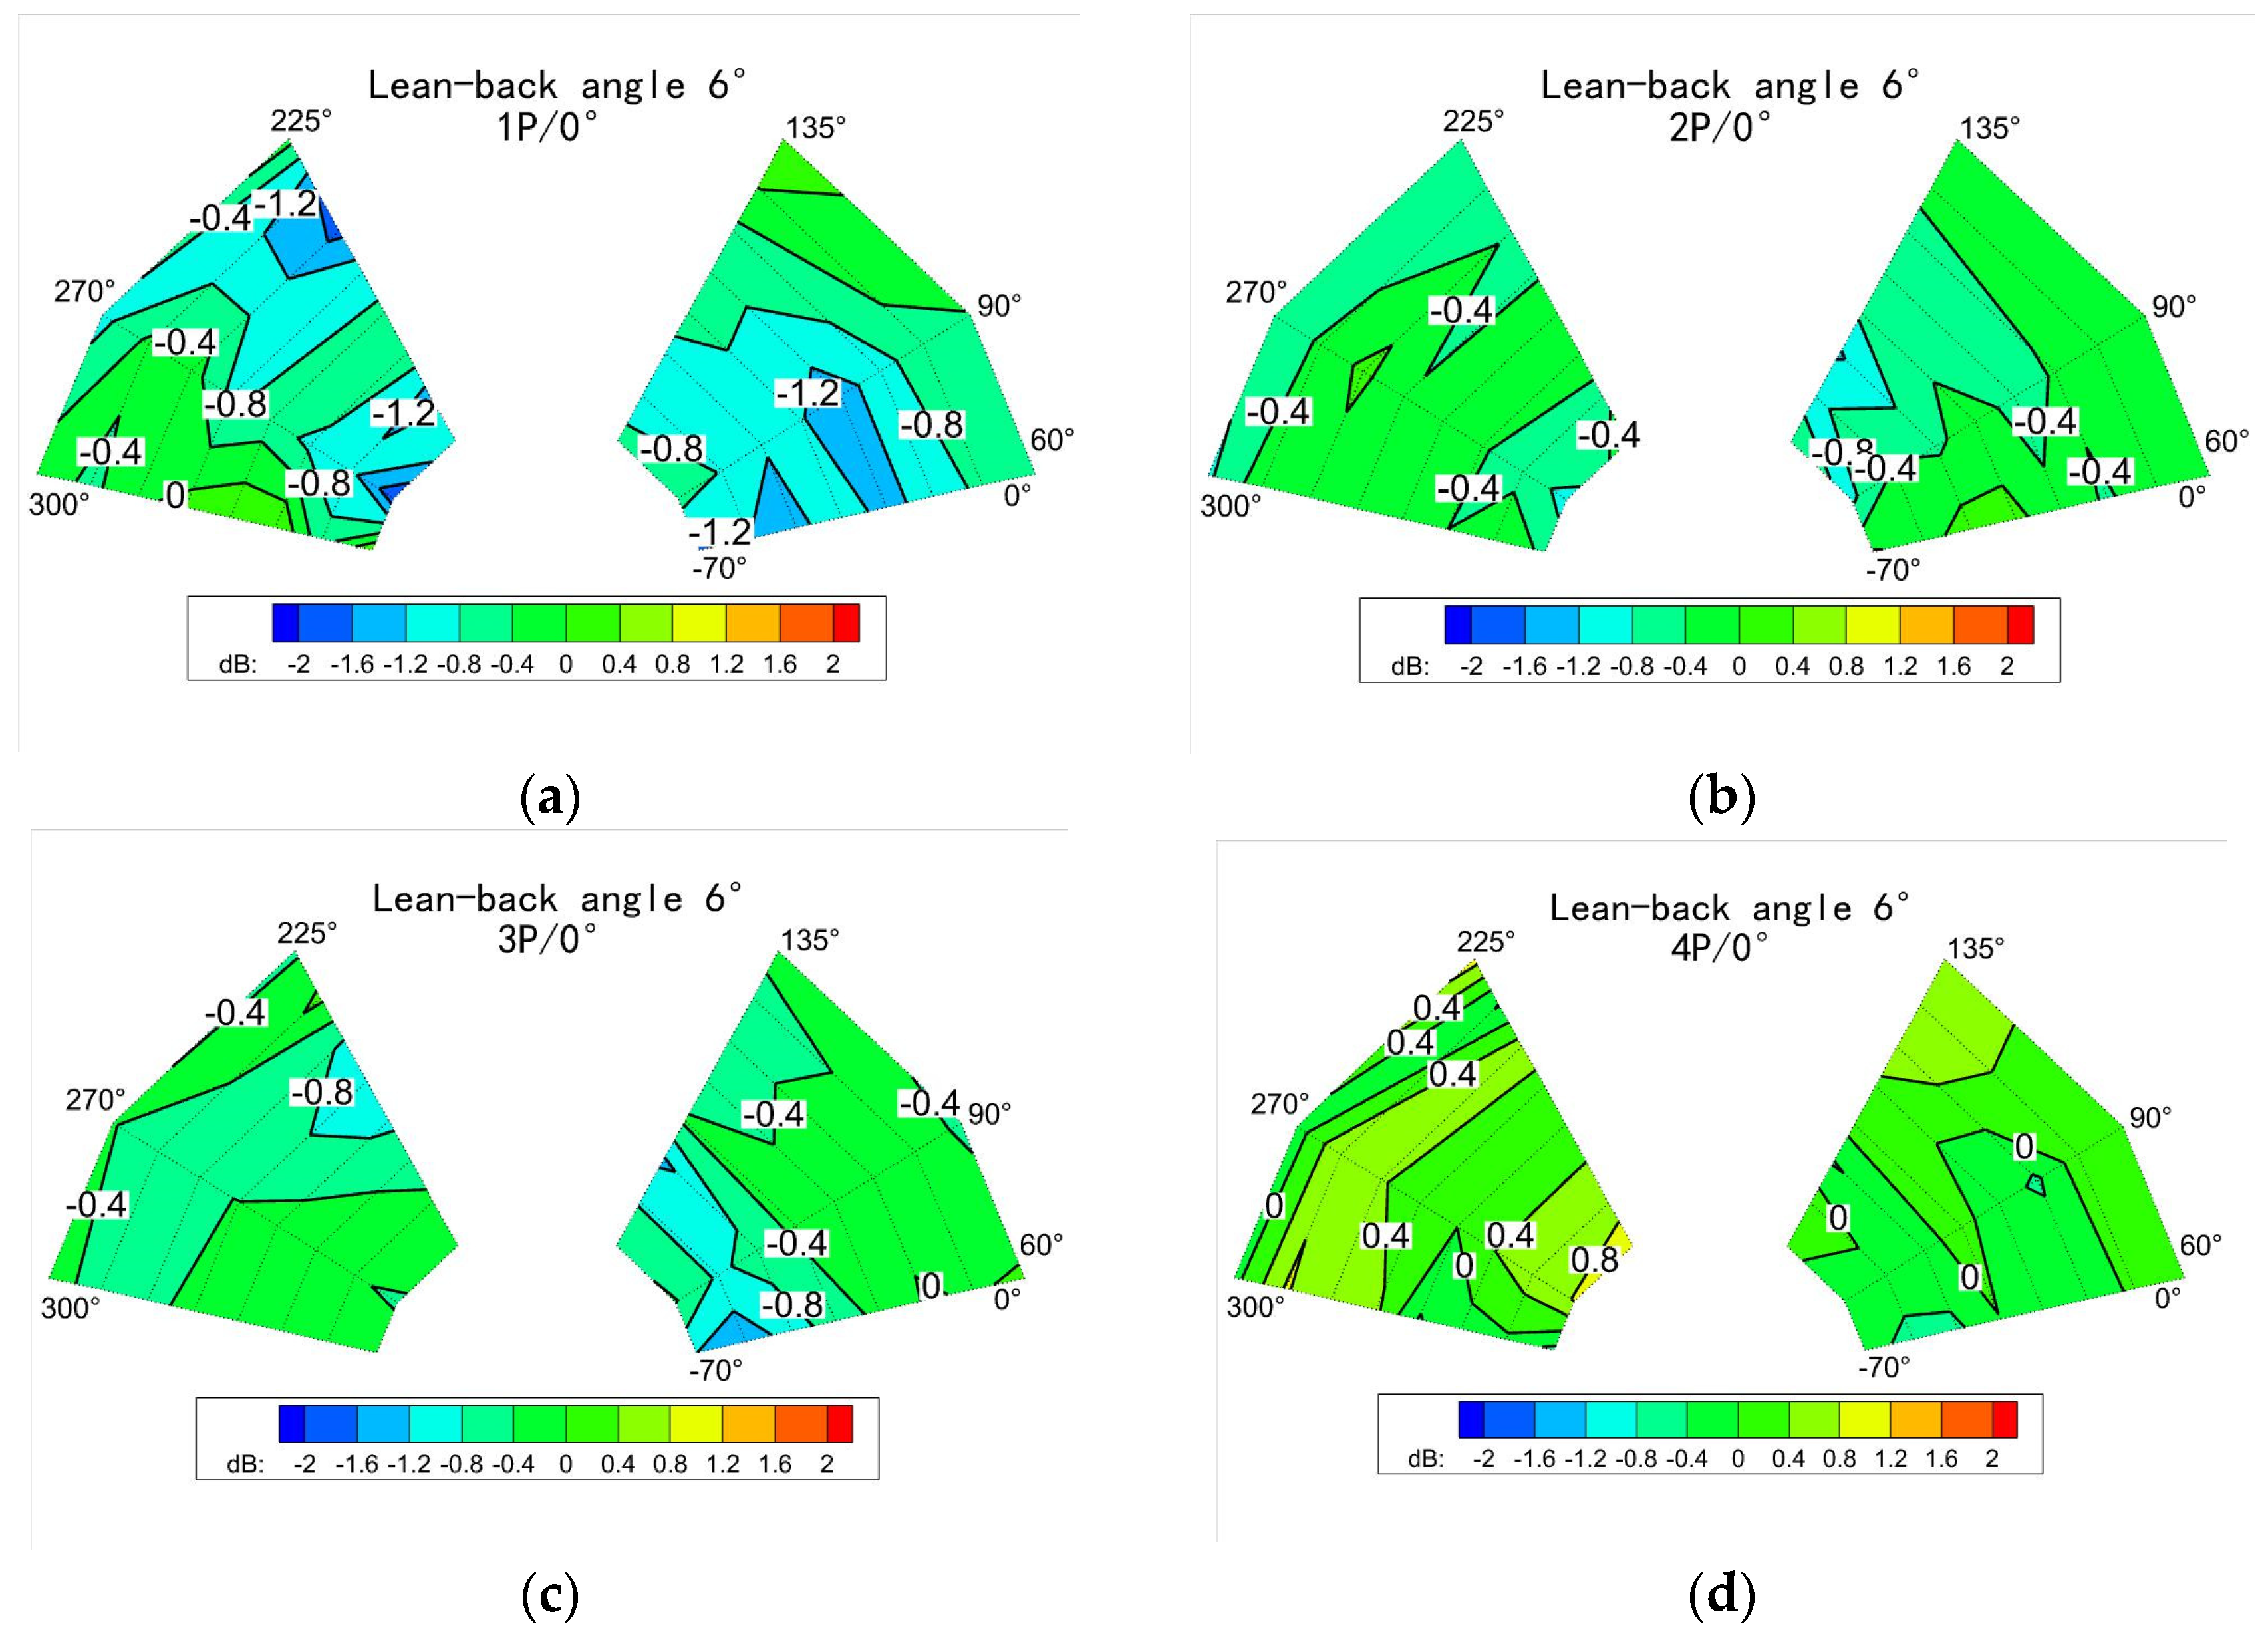
The test for descent with a 6° lean-back angle was carried out in a similar way, as shown in Figure 19. Noise reduction in this case had little relation to the change in deflection frequency. Among the various frequencies, 3P still had some noise reduction effect, but the noise reduction under 1P was the best.
3.2.2. Combination of Frequency and Phase
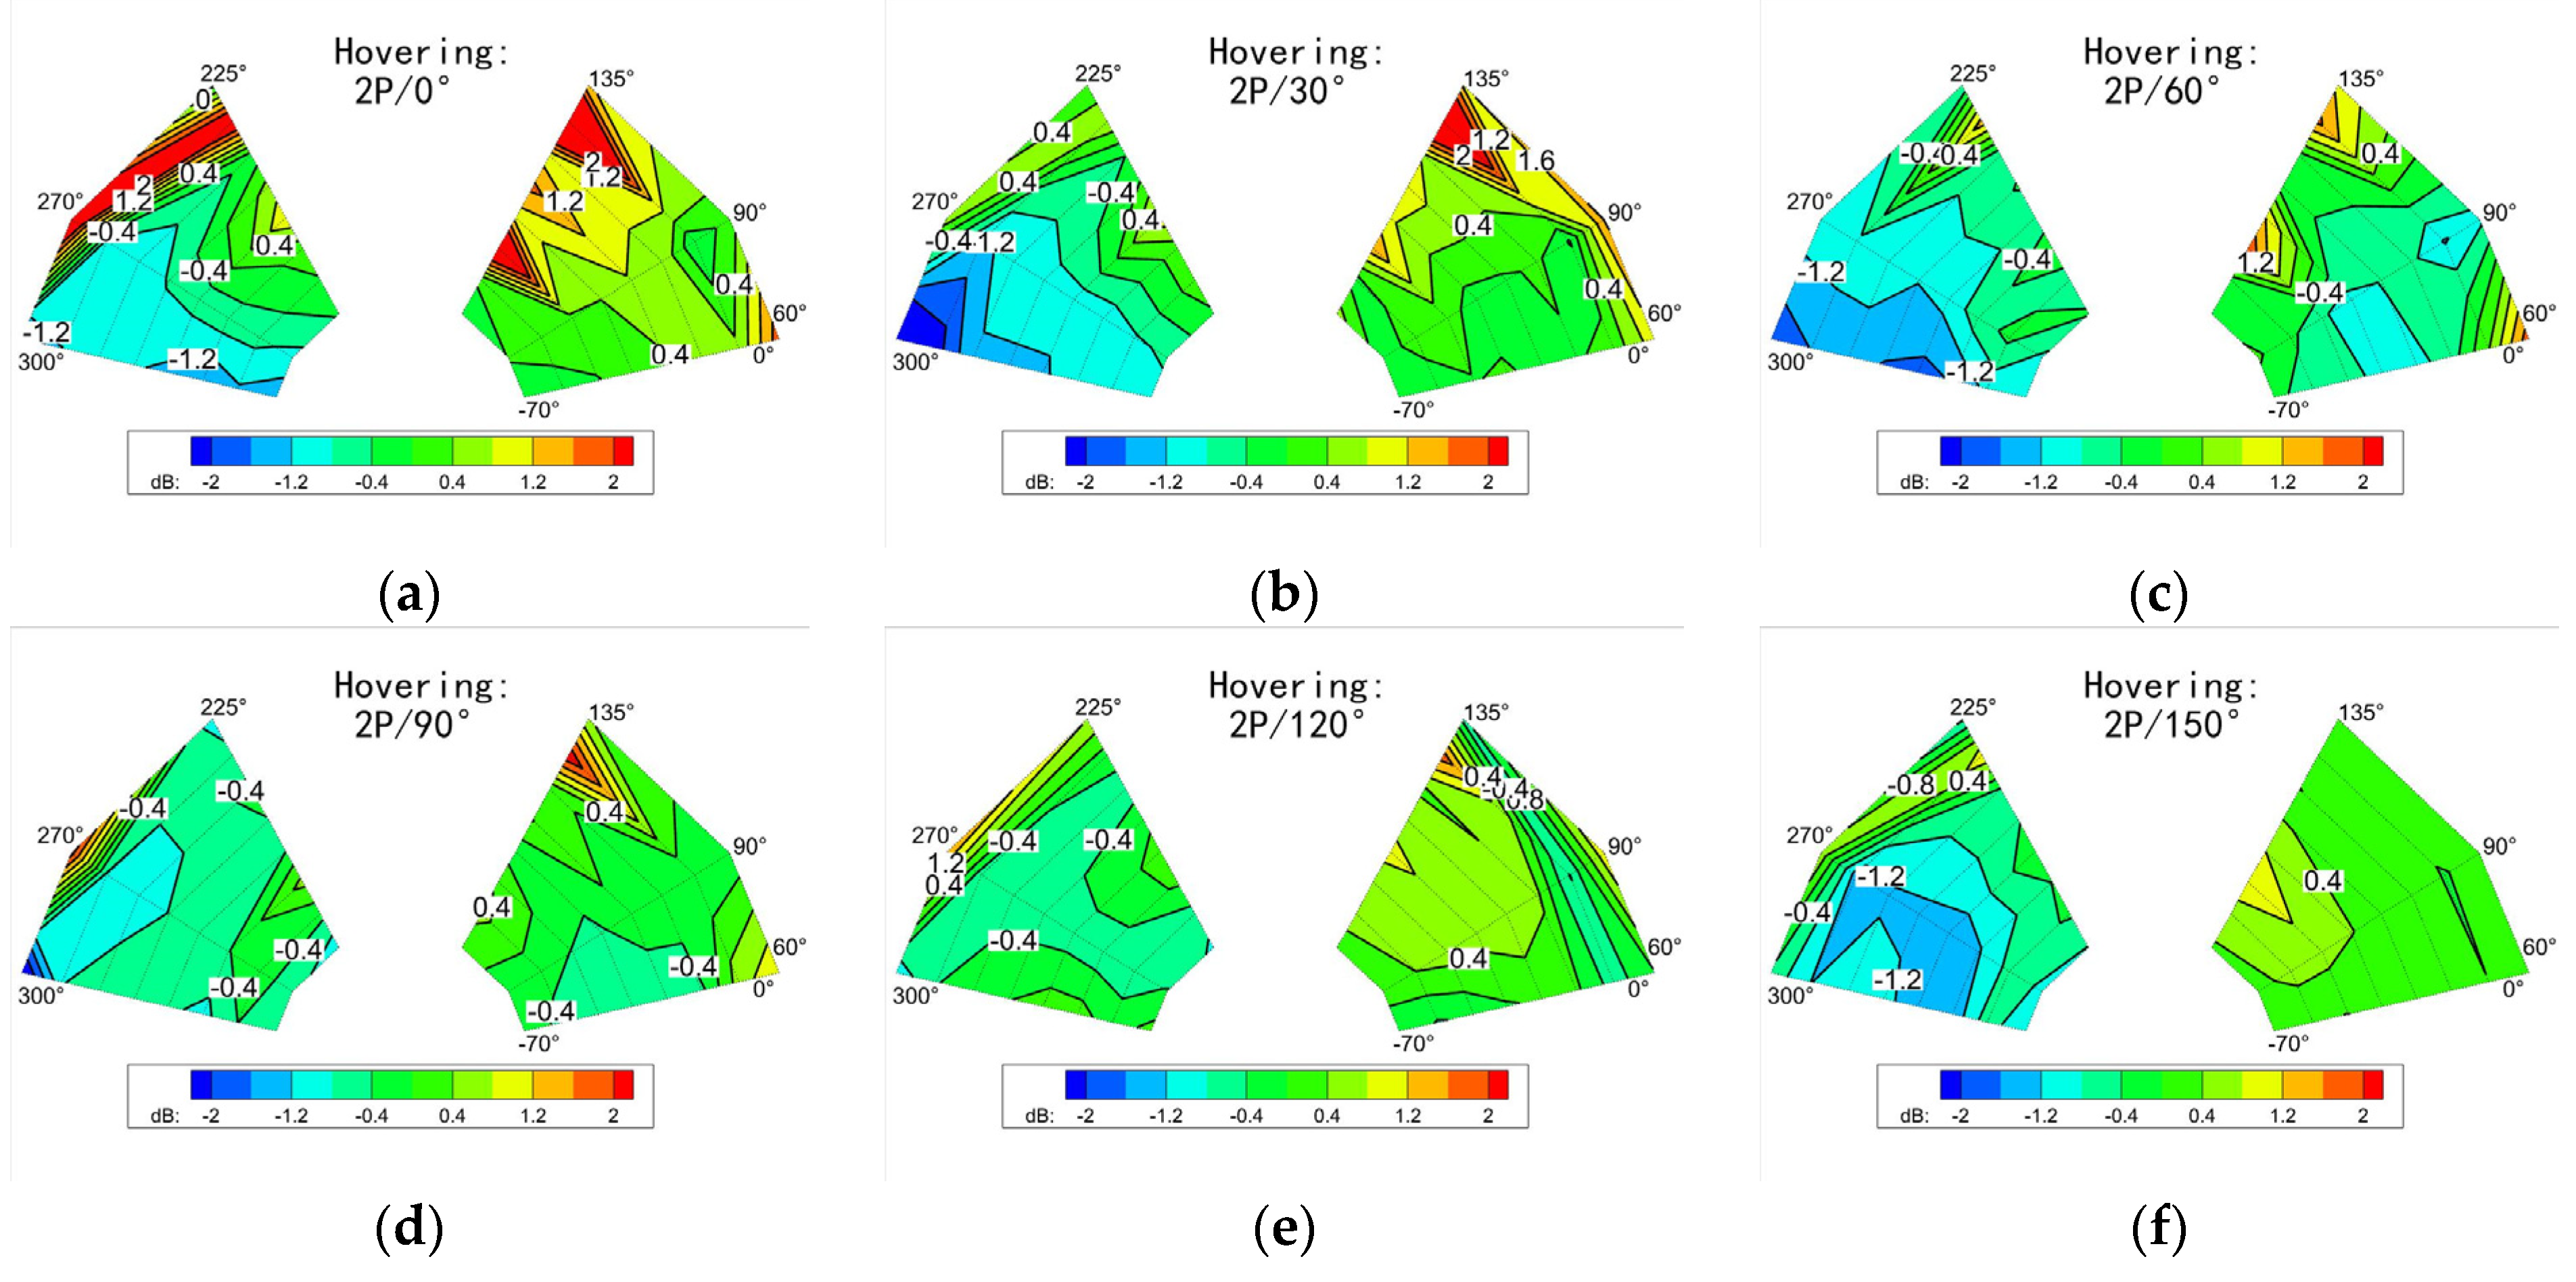
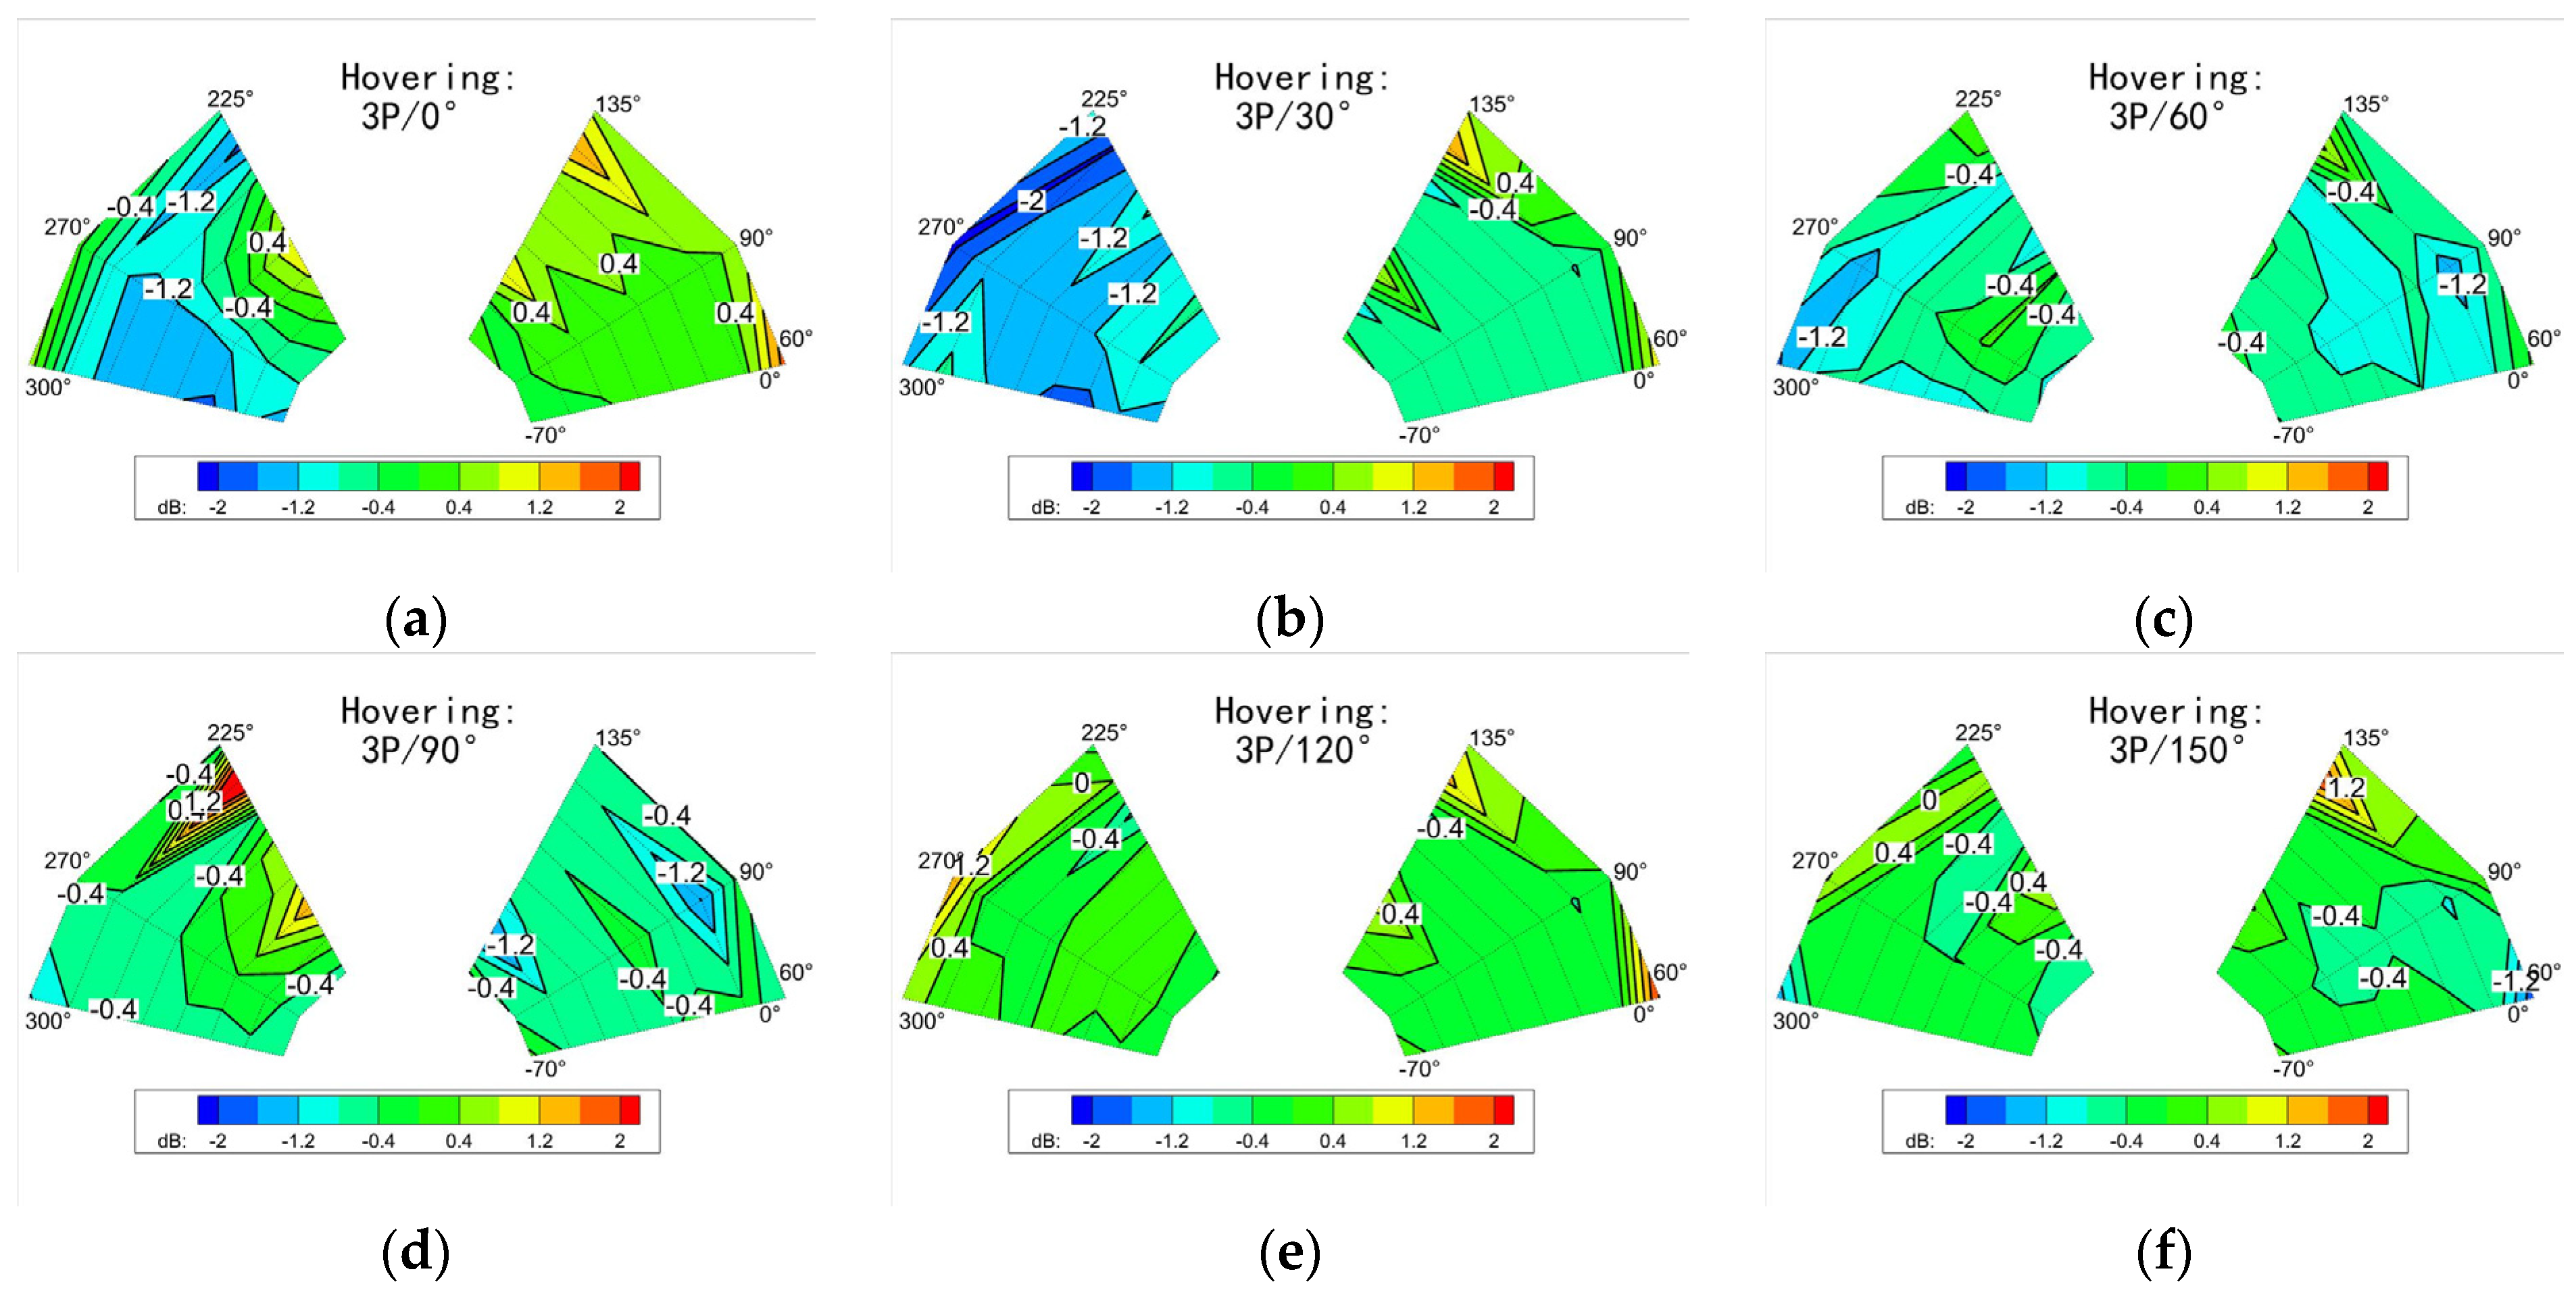
Figure 20 and Figure 21 show the influence of the TEF deflection phase on the change in the noise distribution when hovering under respective control frequencies of 2P and 3P. By comparing these two figures, it can be further confirmed that there were evident differences in the noise reduction in the same phase for different frequencies. In addition, for different frequency–phase combinations, there may be optimal noise reduction control at one frequency with no noise reduction at another frequency. In fact, it may even be increased in some regions, which is similar to the phenomenon in the SMART test [11]. However, it is worth noting that, at both 2P and 3P, increasing the phase made the noise reduction region move gradually towards decreasing azimuth. This is because the control phase became larger, which decreased the blade azimuth, corresponding to the TEF moving to the same deflection angle during rotation.
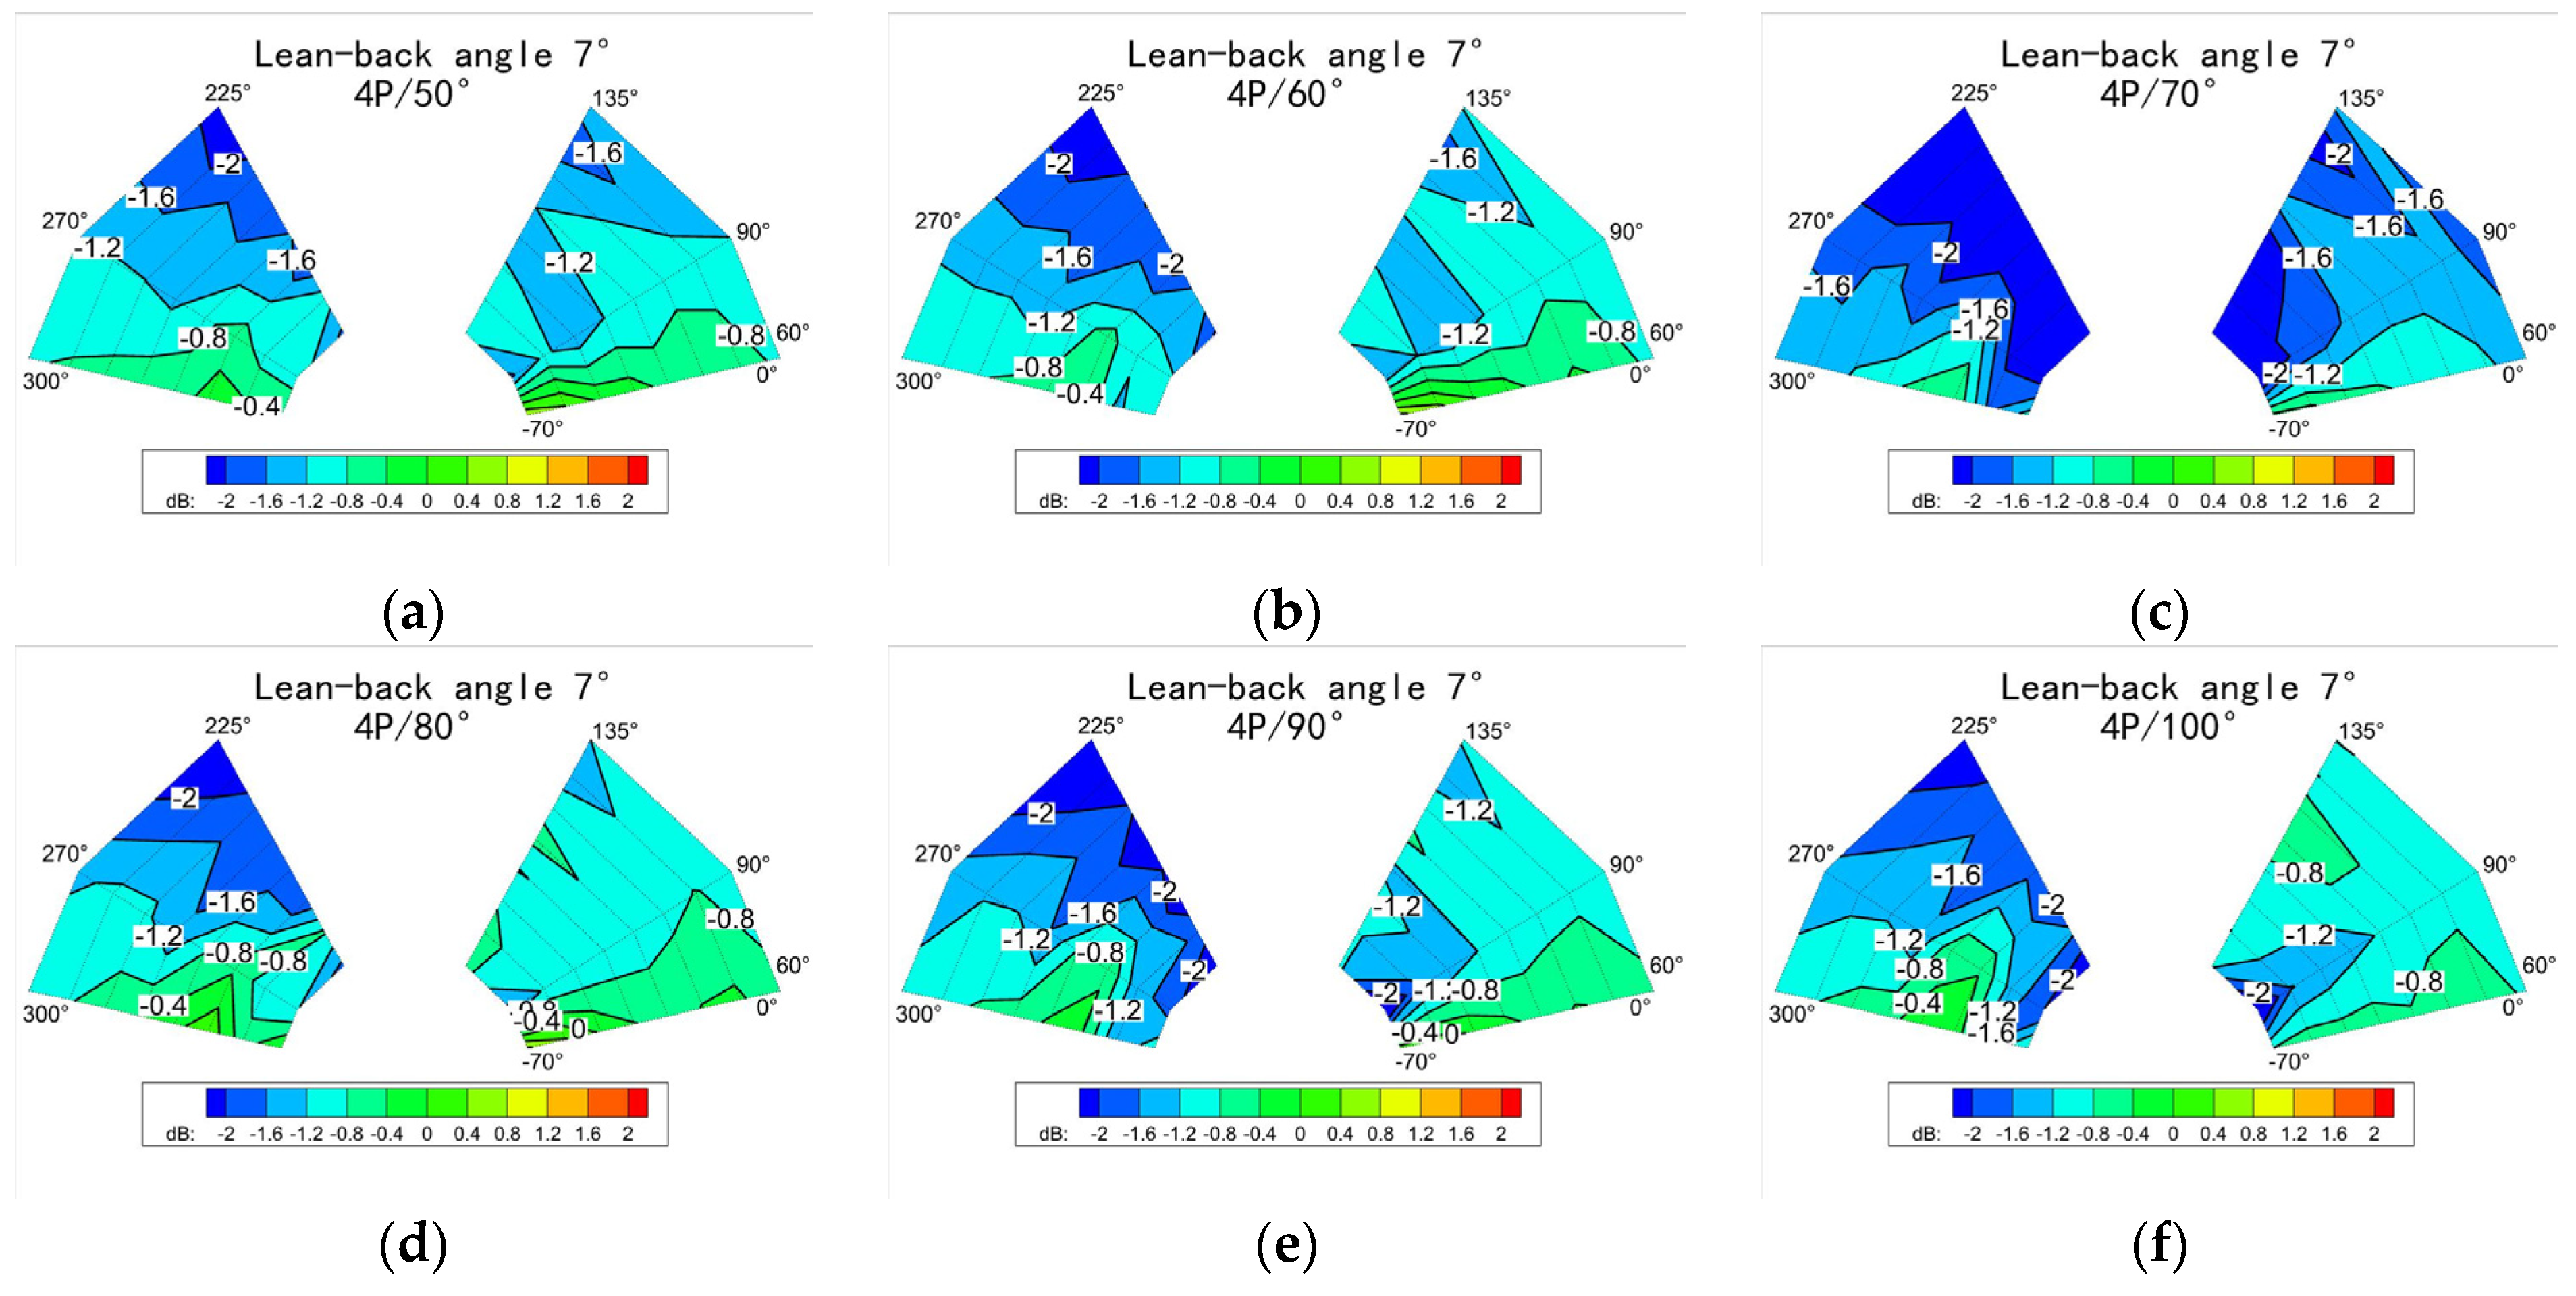
Figure 22 and Figure 23 show, respectively, the noise distribution of measurement points under the control of 3P/forward flight and 4P/7° descending flight (V = 19 m/s). The fundamental rule of variation with phase is still that the noise reduction region moves in the direction of decreasing azimuth angle, which is similar to the behavior when hovering.
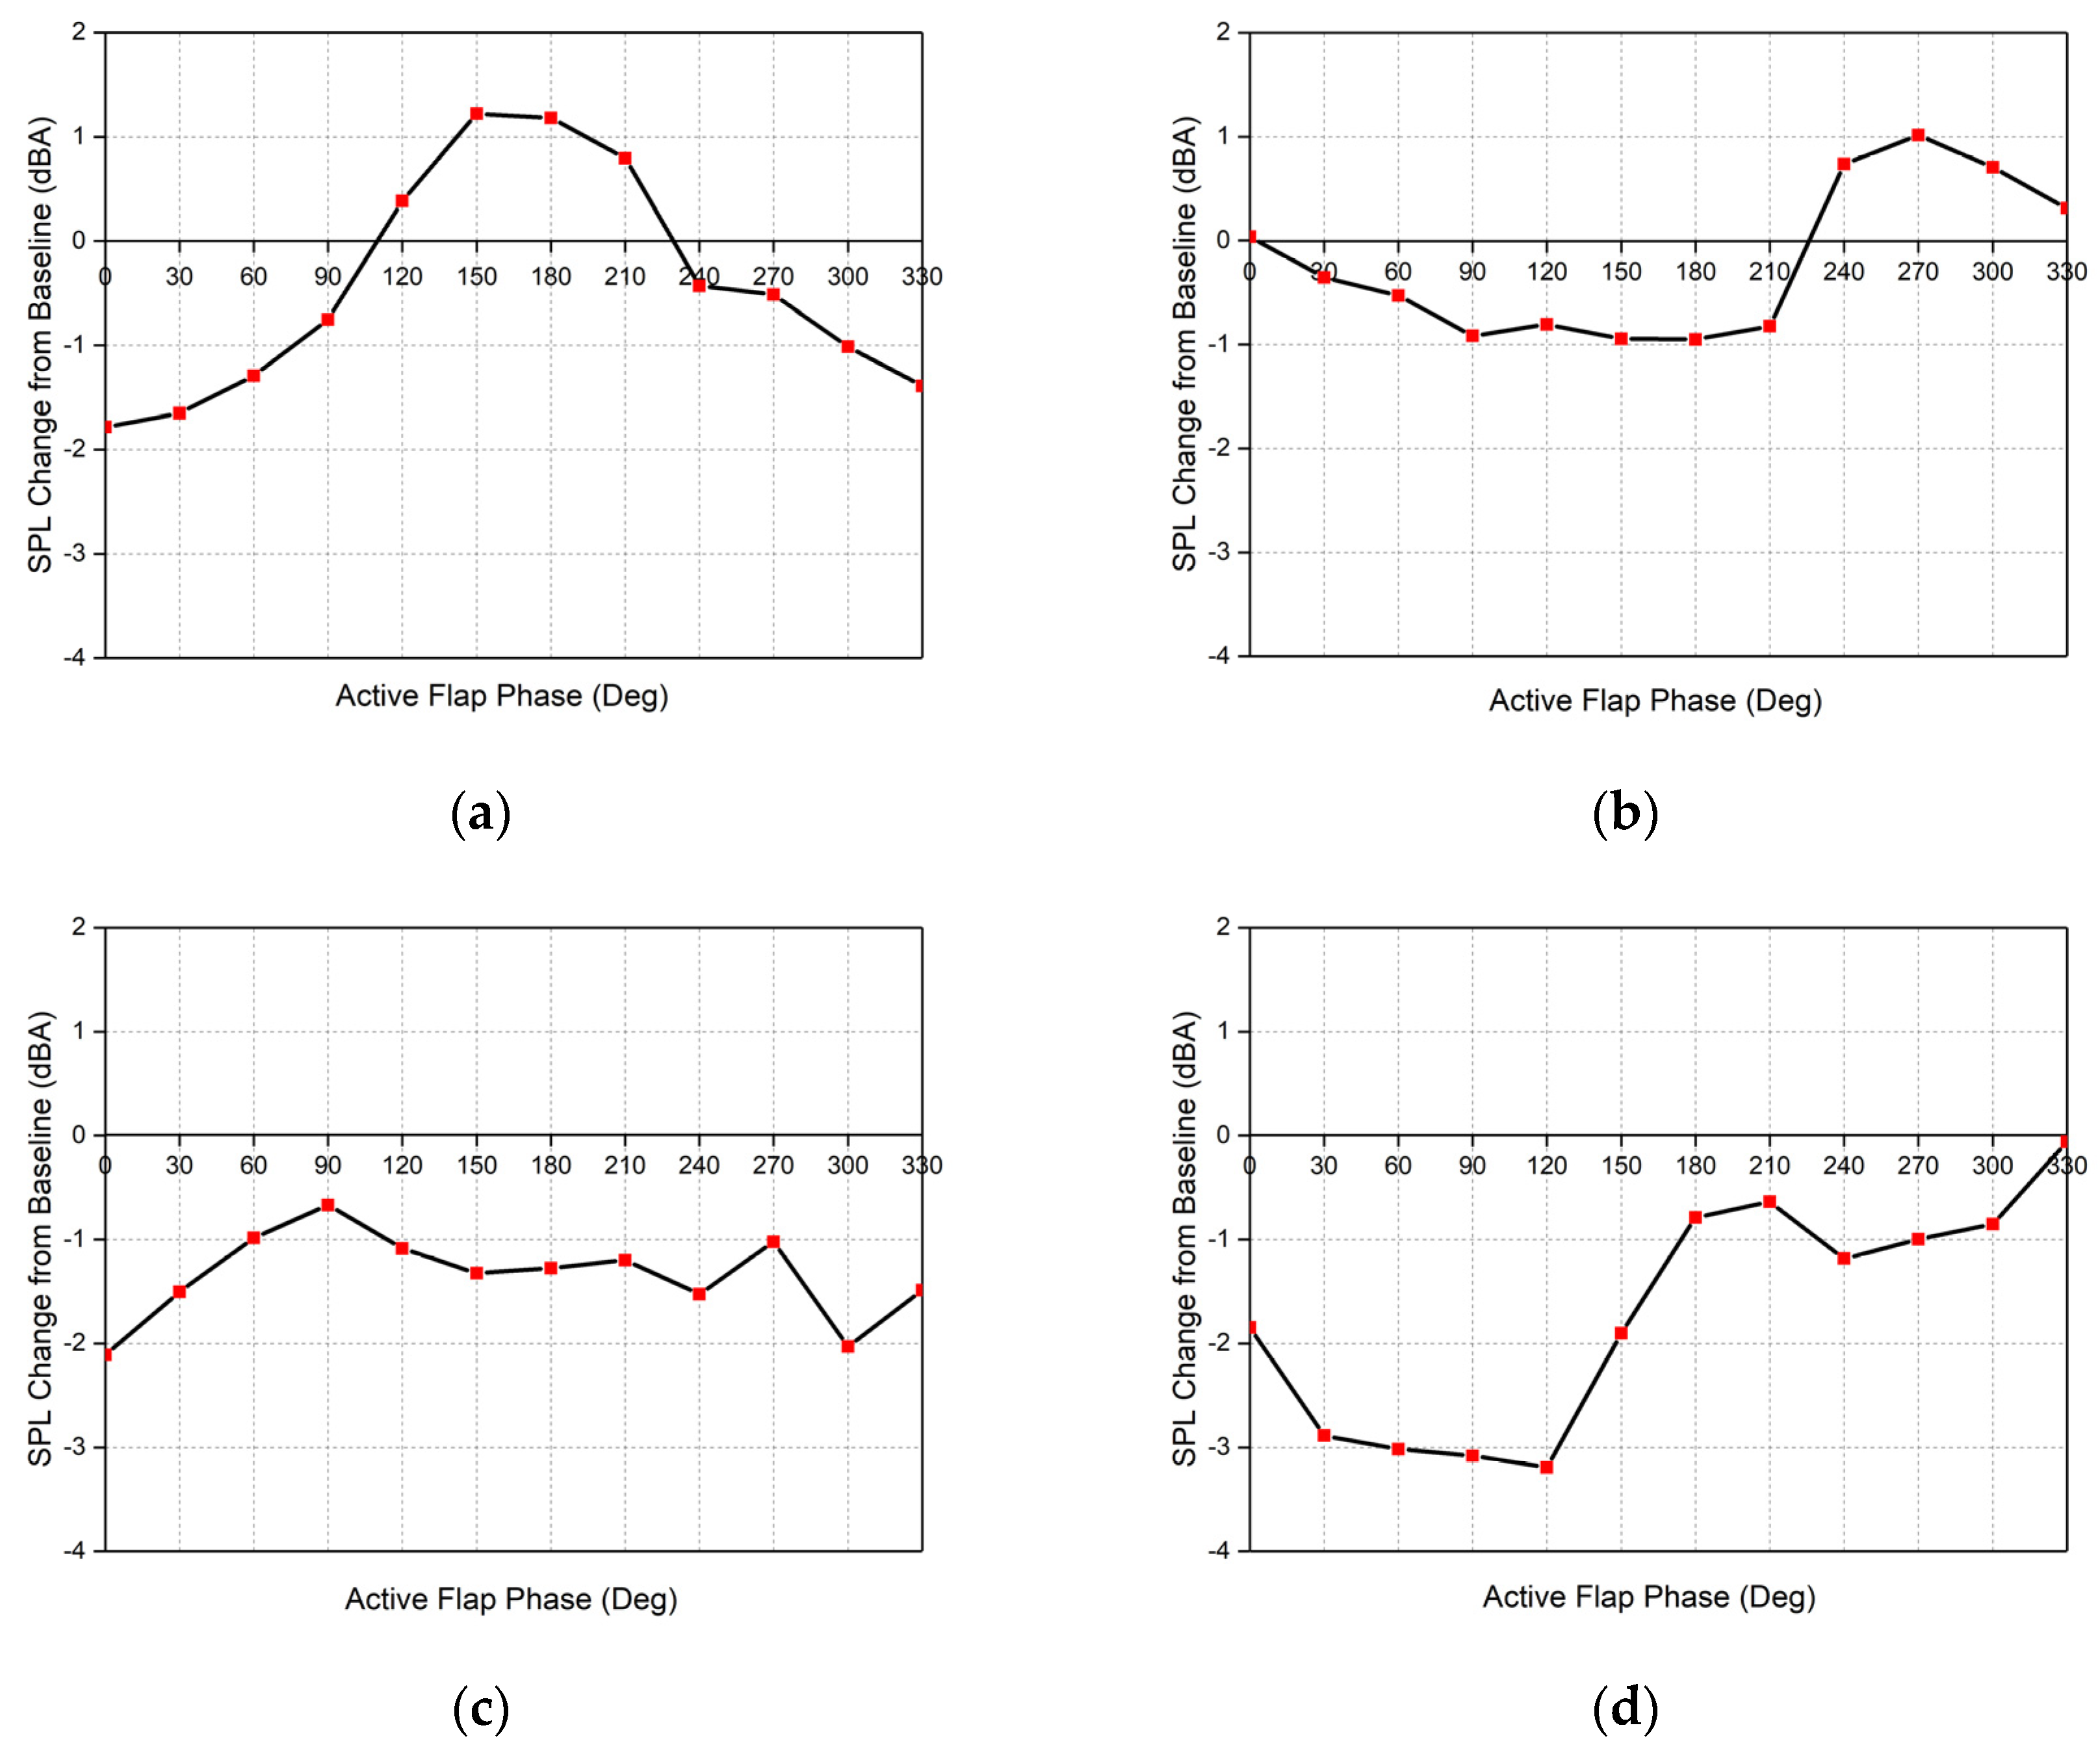
Since oblique descent was in a BVI state, further analysis of the observation points on the V-shaped bracket was needed. Figure 24 shows how the noise changed as the phase of the TEF changed when the control frequency ranged from 1P to 4P measured at Mic 6 of the V-shaped bracket for a 7° lean-back angle. The maximum noise reduction at the observation points of the arc bracket was mostly 1–2 dB, the observed noise reduction degree of the V-shaped bracket was greater than that shown in the foregoing figures, and the maximum noise reduction was 2 dB or more except for 2P. Though noise reduction was achieved in all phases under 3P control, the overall noise reduction effect was the best. An even better maximum noise reduction of 3.2 dB was obtained for 4P /120° phase control.
3.3. The Influence of Single/Dual-TEF Control
We explored the influence of TEF installation position and the effect of single and dual-TEF control. Figure 25 shows the change in noise resulting from single and dual TEFs when the incoming flow velocity was 18 m/s, at a 5° lean-back angle and 4P control frequency. The outboard and dual-TEF control achieved better noise reduction than an inboard TEF deflector alone. This has to do with the fact that the winglets were mounted outwards in a position that made the relative incoming flow larger and the winglets caused greater load changes. Using dual winglets also provided better noise reduction than using a single winglet. Although the simultaneous deflection of dual TEFs could not further improve the maximum noise reduction, it increased the noise reduction region.
For the observation point on the V-shaped bracket, the control test under a 6° lean-back angle was also carried out. The results are shown in Figure 26. When a single inboard TEF was deflected, the maximum noise reduction of 2.61 dB was achieved at phase 120°. However, the maximum noise reduction effect of 3.29 dB was achieved when the phase was 90°, with a single outboard TEF control. This also confirmed that the noise reduction effect was better using an outboard TEF with single TEF control.
However, at a larger lean-back angle of 7°, the noise at Mic 6 of the V-shape bracket was effectively reduced at each initial phase with dual-TEF control, and the maximum reduction was more prominent when compared with the 6° lean-back angle, which reached 3.82 dB at the 90° phase, as shown in Figure 27.
3.4. The Influence of Noise Statistical Period
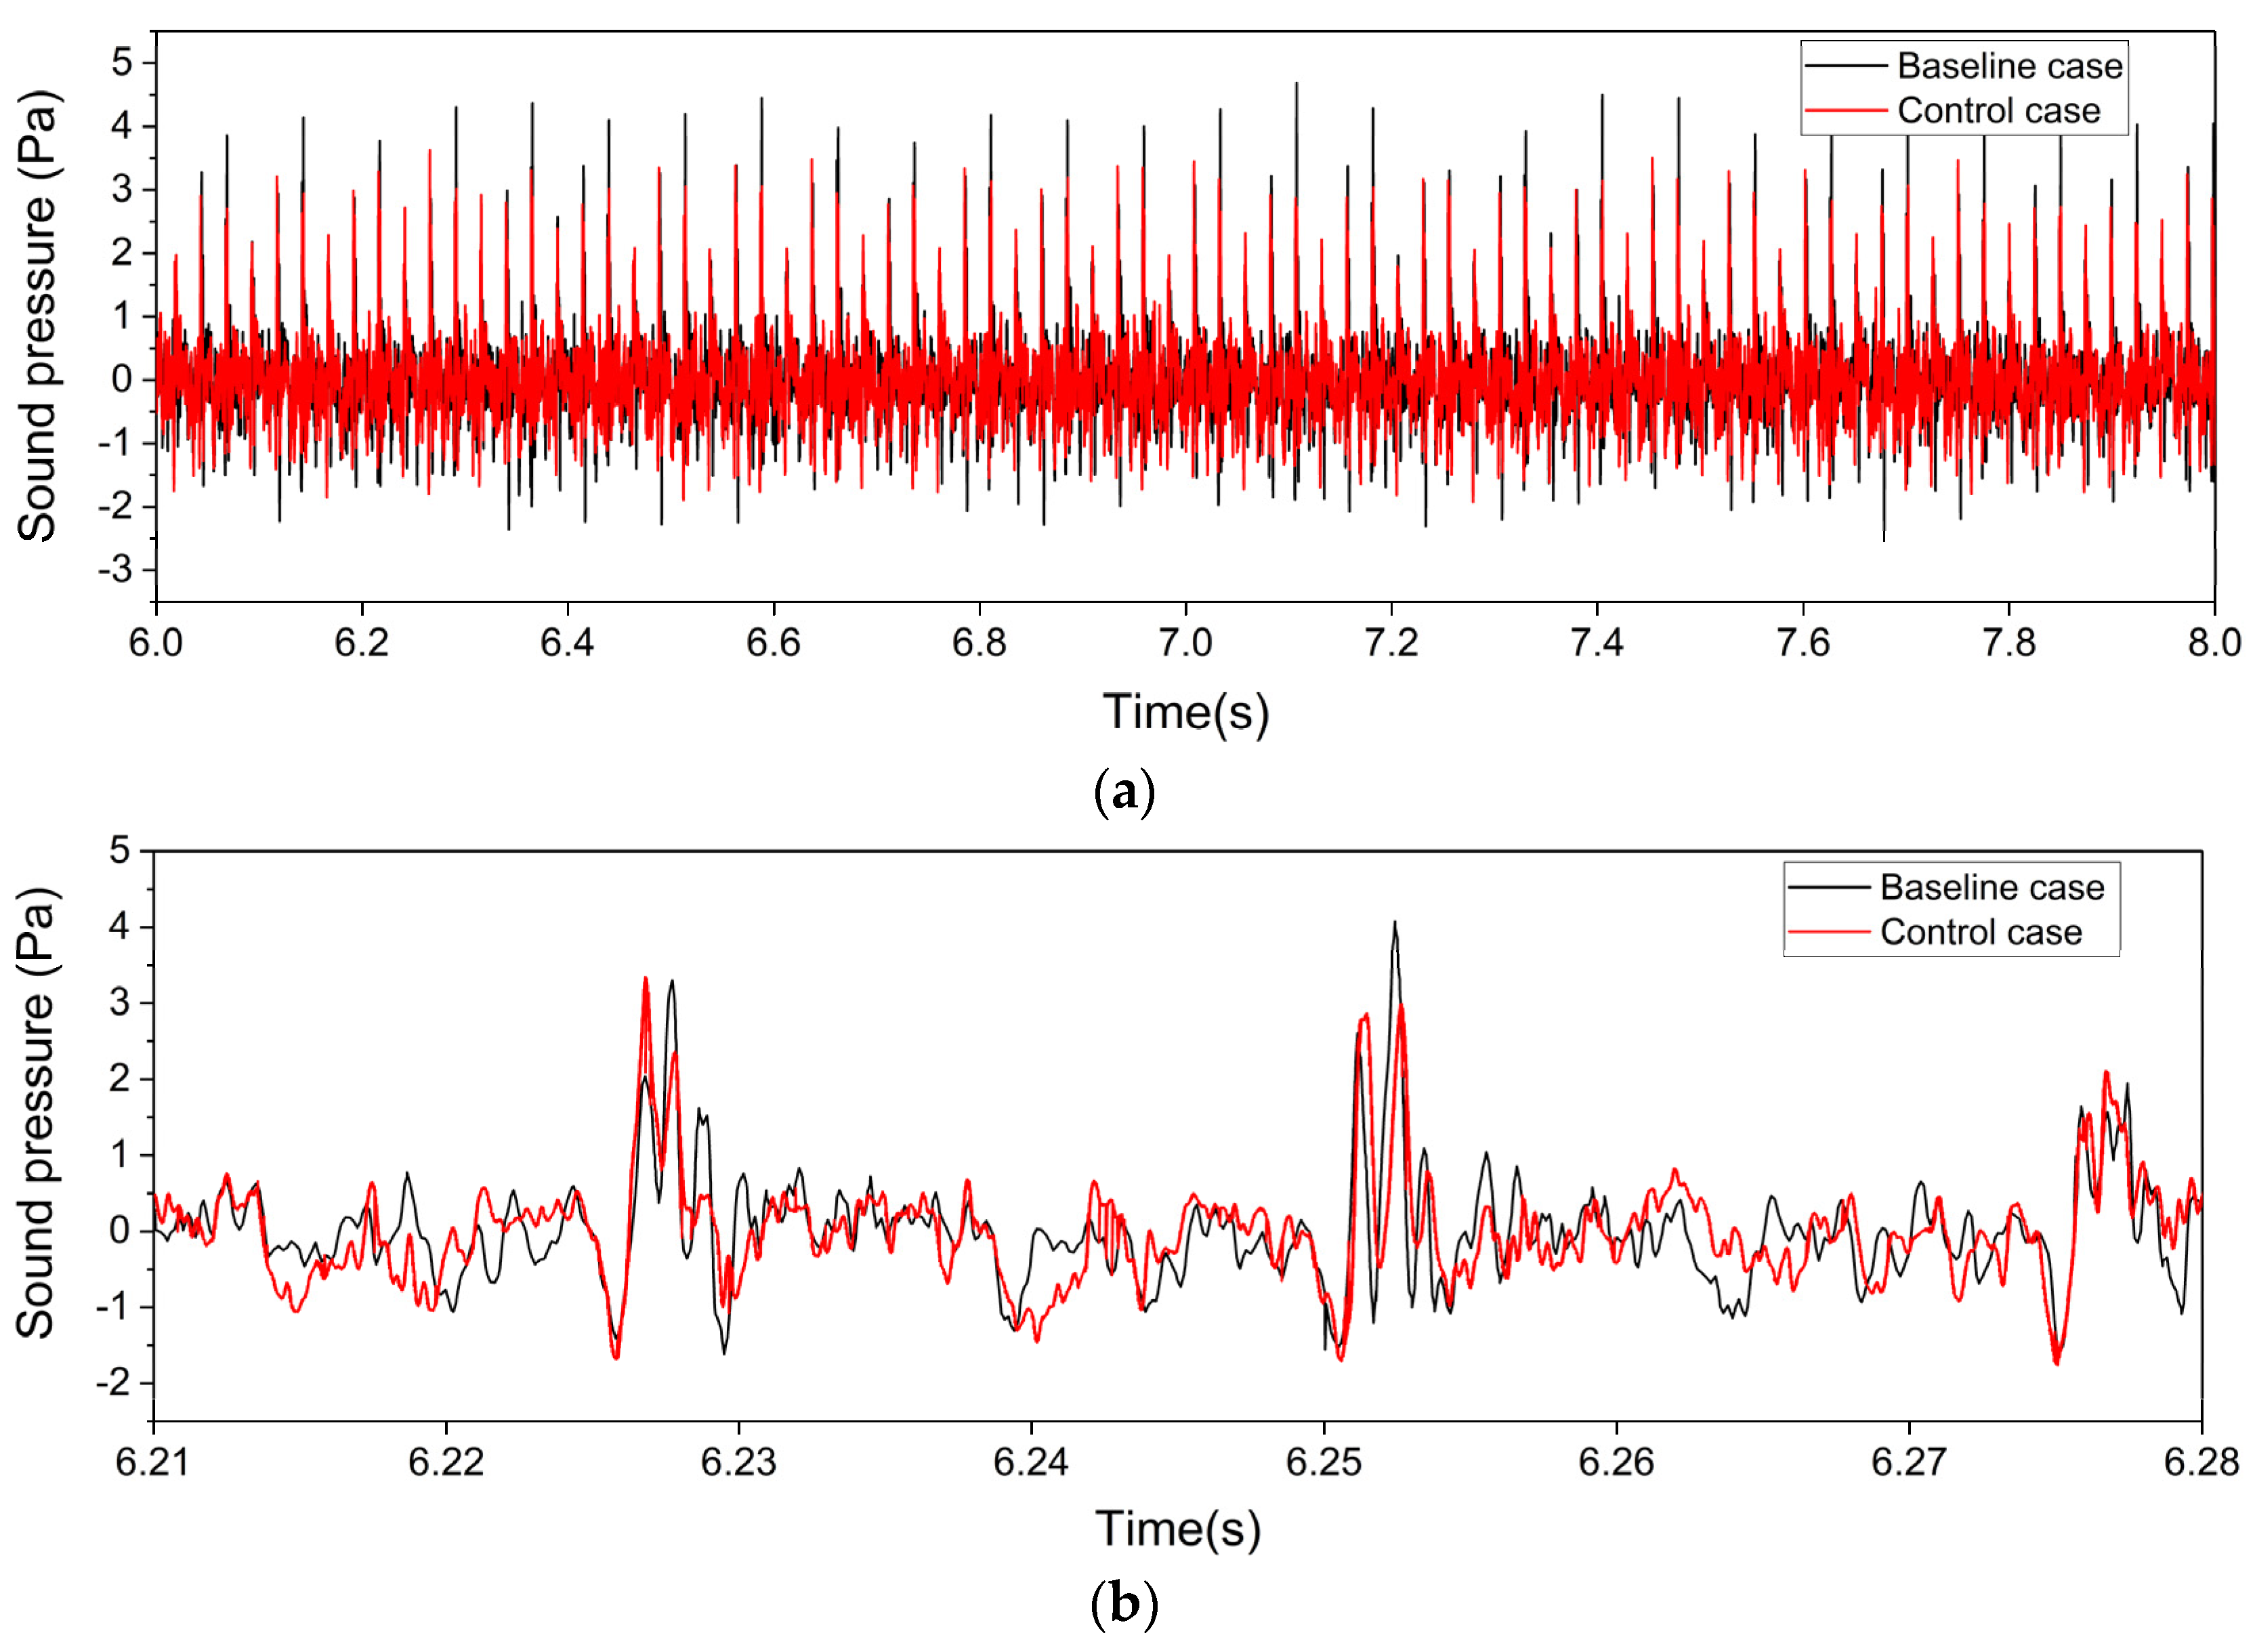
In the data analysis of the AFC noise reduction effect in the hovering, forward flight, and descent scenarios described above, the overall average processing method was considered—a noise-processing program with a microphone acquisition of 18 s of complete sound pressure signal as the object of analysis for a total of about 242 cycles. Each cycle included the noise generated by three blades. Figure 28a shows the time history of sound pressure for 2 s captured from the complete signal duration of 18 s. The sound pressure pattern for other periods was similar. Through this method, the noise amplitude generated over 18 s was processed by A-weighting, leading to a credible result. However, because of the differences in manufacturing procedures, the material distribution was not guaranteed to be entirely consistent. Additionally, the actual blade and TEF quality, length, installation position, and drive control deflection would be slightly different, which caused a certain amount of uncertainty. Therefore, at some point, the noise produced by the three blades would have specific differences, such as in the descent stage of a cycle, when two blades generated relatively intense BVI noise. Still, the BVI noise of the third blade was somewhat less obvious, as shown in Figure 28b.
To better understand this phenomenon, we screened and processed the complete noise period again, to seek a state closer to that giving the ideal expected optimal control effect. Continuous periods with small differences in the time history of noise pressure among the three blades were given priority in data processing, and only the sound pressure data collected during these short periods (about 0.074 s) were processed. Through screening, the rotor noise reduction amplitude measured at each microphone on the V-shaped bracket was found to be 3.6–6.2 dB under a 7° lean-back angle and 4P/dual-TEF control, as shown in Figure 29. This confirmed that AFC control could effectively reduce the BVI noise and that it provided a close-to-ideal noise reduction effect in specific positions.
4. Conclusions
In this study, an active control rotor with a dual-trailing edge flap was designed, and aeroacoustic tests were carried out in the FL-17 acoustic wind tunnel. The tests measured the rotor sound field for different flight states, deflection control laws, deflection mechanism configurations, and other variables. The levels of rotor aerodynamic noise for different states and details of noise reduction behavior were obtained by filtering and analyzing the data gathered in the tests. The conclusions can be summarized as follows:
(1) These tests successfully measured the active flap control (AFC) rotor noise and verified the validity of the data. The corresponding original sound-pressure-filtering algorithm could filter out the interference without destroying the noise characteristics of the rotor;
(2) The collective and flow speed caused noticeable noise differences but had little influence on whether noise reduction could be achieved under AFC control and had only a small influence on noise reduction amplitude. However, decreasing flight velocity would cause a change in the noise reduction region;
(3) Frequency and phase combinations directly affected the control effect, and the third- and fourth-order control effects were relatively strong. At the same time, the region where the noise was damped would move in the direction of decreasing azimuth with an increase in the initial excitation phase;
(4) For the same control law, the noise reduction effect was greater for the outboard trailing edge flap (TEF) control. The noise reduction controlled by dual TEFs was better than that under the control of a single TEF;
(5) The test data showed that the use of AFC could effectively reduce BVI noise by using the continuous periodic processing method, with the results showing little difference between the blades, and a maximum noise reduction of 6.2 dB could be achieved.
Author Contributions
Conceptualization, G.X.; methodology, Y.S.; data curation, Z.H.; writing—original draft preparation, Z.H.; writing—review and editing, Y.L. and Y.S.; visualization, Z.H. and Y.L. All authors have read and agreed to the published version of the manuscript.
Funding
This study was supported by the Priority Academic Program Development (PAPD) of Jiangsu Higher Education Institutions and National Natural Science Foundation of China (NSFC)’s Project (Grant No. 11972190).
Acknowledgments
The authors thank Ronghai Li for his work in the experiment.
Conflicts of Interest
The authors declare no conflict of interest.
References
- George, A.R. Helicopter Noise: State-of-the-Art. J. Aircr. 1978, 15, 707–715. [Google Scholar] [CrossRef]
- Yung, H.Y. Rotor Blade–Vortex Interaction Noise. Prog. Aerosp. Sci. 2000, 36, 97–115. [Google Scholar]
- Baeder, J.D.; Gallman, J.M.; Yu, Y.H. A Computational Study of the Aeroacoustics of Rotors in Hover. J. Am. Helicopter Soc. 1997, 42, 39–53. [Google Scholar] [CrossRef]
- Hares, H.; Mebarki, G.; Brioua, M.; Naoun, M. Aerodynamic Performances Improvement of Naca 4415 Profile by Passive Flow Control Using Vortex Generators. J. Serb. Soc. Comput. Mech. 2019, 13, 17–38. [Google Scholar] [CrossRef] [Green Version]
- van der Wall, B.G.; Kessler, C.; Delrieux, Y.; Beaumier, P.; Gervais, M.; Hirsch, J.F.; Pengel, K.; Crozier, P. From Erato Basic Research to the Blue Edge Rotor Blade. In Proceedings of the AHS 72nd Annual Forum, West Palm Beach, FL, USA, 17–19 May 2016; American Helicopter Society, Inc. [Google Scholar]
- Buck, S.; Oerlemans, S.; Hernandez Mascarell, O.; Joseph, P.; Alexander, W.N.; Letica, S. Active Control of Trailing Edge Noise. In Proceedings of the Aiaa Aviation 2021 Forum, Online, 2–6 August 2021. [Google Scholar]
- Kessler, C. Active Rotor Control for Helicopters: Individual Blade Control and Swashplateless Rotor Designs. CEAS Aeronautical J. 2011, 1, 23–54. [Google Scholar] [CrossRef]
- Milgram, J.; Chopra, I.; Straub, F. Rotors with Trailing Edge Flaps: Analysis and Comparison with Experimental Data. J. Am. Helicopter Soc. 1998, 43, 319–332. [Google Scholar] [CrossRef]
- Millott, T.A.; Friedmann, P.P. Vibration Reduction in Helicopter Rotors Using an Actively Controlled Partial Span Trailing Edge Flap Located on the Blade; NASA: Washington, DC, USA, 1994.
- Liu, L.; Friedmann, P.P.; Kim, I.; Bernstein, D.S. Rotor Performance Enhancement and Vibration Reduction in Presence of Dynamic Stall Using Actively Controlled Flaps. J. Am. Helicopter Soc. 2008, 53, 338–350. [Google Scholar] [CrossRef] [Green Version]
- Sim, B.W.; JanakiRam, R.D.; Lau, B.H. Reduced in-Plane, Low-Frequency Noise of an Active Flap Rotor. J. Am. Helicopter Soc. 2014, 59, 1–17. [Google Scholar] [CrossRef]
- Aoyama, T.; Yang, C.; Kondo, N.; Saito, S. Comparison of Noise Reduction Effect between Afc and Conventional Ibc by Moving Overlapped Grid Method. In Proceedings of the 12th AIAA/CEAS Aeroacoustics Conference (27th AIAA Aeroacoustics Conference), Cambridge, MA, USA, 8–10 May 2006. [Google Scholar]
- Su, T.; Lu, Y.; Ma, J.; Guan, S. Aerodynamic Characteristics Analysis of Electrically Controlled Rotor Based on Viscous Vortex Particle Method. Aerosp. Sci. Technol. 2020, 97, 105645. [Google Scholar] [CrossRef]
- Zhou, Z.X.; Huang, X.C.; Tian, J.J.; Hua, H.X.; Tang, M.; Wang, C. Numerical and Experimental Analysis on the Helicopter Rotor Dynamic Load Controlled by the Actively Trailing Edge Flap. Smart Mater. Struct. 2022, 31, 35023. [Google Scholar] [CrossRef]
- Yung, H.Y.; Gmelin, B.; Splettstoesser, W.; Philippe, J.J.; Prieur, J.; Brooks, T.F. Reduction of Helicopter Blade-Vortex Interaction Noise by Active Rotor Control Technology. Prog. Aerosp. Sci. 1997, 33, 647–687. [Google Scholar]
- Noboru, K.; Saito, S.; Fuse, H. A Study of Closed Loop Control for Bvi Noise Reduction by Multiple Pressure Sensors. In Proceedings of the 33rd European Rotorcraft Forum, Kazan, Russia, 11–13 September 2007; pp. 2315–2356. [Google Scholar]
- Ma, J.; Lu, Y.; Su, T.; Guan, S. Experimental Research of Active Vibration and Noise Control of Electrically Controlled Rotor. Chin. J. Aeronaut. 2021, 34, 106–118. [Google Scholar]
- DeSalvo, M.; Whalen, E.; Glezer, A. High-Lift Performance Enhancement Using Active Flow Control. AIAA J. 2020, 58, 4228–4242. [Google Scholar] [CrossRef]
- Ma, Y.Y.; Zhao, Q.J.; Zhao, G.Q. New Combinational Active Control Strategy for Improving Aerodynamic Characteristics of Airfoil and Rotor. Proc. Inst. Mech. Eng. Part G J. Aerosp. Eng. 2019, 234, 977–996. [Google Scholar] [CrossRef]
- Zhou, J.; Dong, L.; Yang, W. Experimental Study on Transfer Functions of an Active Rotor under Different Flight Conditions. Chin. J. Aeronaut. 2022, 35, 107–120. [Google Scholar]
- Konstanzer, P.; Enenkl, B.; Aubourg, P.; Cranga, P. Recent Advances in Eurocopter’s Passive and Active Vibration Control. In Proceedings of the AHS 64th Annual Forum, Montréal, QC, Canada, 29 April–1 May 2008; American Helicopter Society, Inc. [Google Scholar]
- Woods, B.; Bubert, E.; Kothera, C.; Sirohi, J.; Wereley, N. Experimental Testing of Pneumatic Artificial Muscles for Trailing Edge Flap Actuation. In Proceedings of the 48th AIAA/ASME/ASCE/AHS/ASC Structures, Structural Dynamics, and Materials Conference, Honolulu, HI, USA, 23–26 April 2007. [Google Scholar]
- Altmikus, A.; Dummel, A.; Heger, R.; Schimke, D. Actively Controlled Rotor: Aerodynamic and Acoustic Benefit for the Helicopter Today and Tomorrow. In Proceedings of the 34th European Rotorcraft Forum, Liverpool, UK, 16–19 September 2008. [Google Scholar]
- Lau, B.H.; Straub, F.; Anand, V.R.; Birchette, T. Smart Rotor Development and Wind-Tunnel Test. In Proceedings of the 35th European Rotorcraft Forum, Hamburg, Germany, 22–25 September 2009. [Google Scholar]
- Bartholomay, S.; Wester, T.T.; Perez-Becker, S.; Konze, S.; Menzel, C.; Hölling, M.; Spickenheuer, A.; Peinke, J.; Nayeri, C.N.; Paschereit, C.O.; et al. Pressure-Based Lift Estimation and Its Application to Feedforward Load Control Employing Trailing-Edge Flaps. Wind. Energy Sci. 2021, 6, 221–245. [Google Scholar] [CrossRef]
- Nakao, M.; Uchiyama, N.; Yoshimoto, M.; Saito, S.; Kondo, N. Research for the Bvi Noise Reduction Using the Blade Active Control. In Proceedings of the 30th European Rotorcraft Forum, Marseille, France, 2014. [Google Scholar]
- Kody, F.; Corle, E.; Maughmer, M.D.; Schmitz, S. Higher-Harmonic Deployment of Trailing-Edge Flaps for Rotor-Performance Enhancement and Vibration Reduction. J. Aircr. 2016, 53, 333–342. [Google Scholar] [CrossRef]
- Padthe, A.K.; Friedmann, P.P. Simultaneous Blade–Vortex Interaction Noise and Vibration Reduction in Rotorcraft Using Microflaps, Including the Effect of Actuator Saturation. J. Am. Helicopter Soc. 2015, 60, 1–16. [Google Scholar] [CrossRef]
- Hu, Z.; Xu, G.; Shi, Y. A Robust Overset Assembly Method for Multiple Overlapping Bodies. Int. J. Numer. Methods Fluids 2020, 93, 653–682. [Google Scholar] [CrossRef]
- Xia, R.; Shi, Y.; Li, T.; Xu, G. Numerical Study of the Rotor Thickness Noise Reduction Based on the Concept of Sound Field Cancellation. Chin. J. Aeronaut. 2022, 35, 214–233. [Google Scholar]
- Zhou, J.; Dong, L.; Yang, W. A Double-Acting Piezoelectric Actuator for Helicopter Active Rotor. Actuators 2021, 10, 247. [Google Scholar] [CrossRef]
- Shi, Y.; Li, T.; He, X.; Dong, L.; Xu, G. Helicopter Rotor Thickness Noise Control Using Unsteady Force Excitation. Appl. Sci. 2019, 9, 1351. [Google Scholar] [CrossRef] [Green Version]
- Farassat, F. Derivation of Formulations 1 and 1a of Farassat; The NASA Scientific and Technical Information: Washington, DC, USA, 2007; p. 20.
- Shi, Y.J.; Zhao, Q.J.; Xu, G.H. An Analytical Study of Parametric Effects on Rotor—Vortex Interaction Noise. Proc. Inst. Mech. Eng. Part G J. Aerosp. Eng. 2011, 225, 259–268. [Google Scholar] [CrossRef]
- Viswamurthy, S.; Ranjan, G. Effect of Piezoelectric Hysterisis Nonlinearity on Helicopter Vibration Control Using Trailing Edge Flaps. In Proceedings of the 46th AIAA/ASME/ASCE/AHS/ASC Structures, Structural Dynamics and Materials Conference, Austin, TX, USA, 18–21 April 2005. [Google Scholar]
- Houser, D.S.; Yost, W.; Burkard, R.; Finneran, J.J.; Reichmuth, C.; Mulsow, J. Review of the History, Development and Application of Auditory Weighting Functions in Humans and Marine Mammals. J. Acoust Soc. Am. 2017, 141, 1371. [Google Scholar] [CrossRef] [PubMed] [Green Version]
- Atia, A.E.; Williams, A.E. Narrow-Bandpass Waveguide Filters. IEEE Trans. Microw. Theory Tech. 1972, 20, 258–265. [Google Scholar] [CrossRef]
- Prieur, J.; Rahier, G. Comparison of Ffowcs Williams-Hawkings and Kirchhoff Rotor Noise Calculations. In Proceedings of the 4th AIAA/CEAS Aeroacoustics Conference, Toulouse, France, 2–4 June 1998. [Google Scholar]
Figure 1.
The AFC rotor: (a) NASA–Boeing’s SMART rotor; (b) an AFC rotor in China.

Figure 2.
Concept of sound field active cancelation for noise reduction.

Figure 3.
The simulation results of rotor disk loading: (a) without AFC control; (b) with AFC control ().
Figure 3.
The simulation results of rotor disk loading: (a) without AFC control; (b) with AFC control ().

Figure 4.
The geometry of an AFC rotor and an actual blade: (a) the blade profile; (b) the AFC rotor profile; (c) the actual blade.
Figure 4.
The geometry of an AFC rotor and an actual blade: (a) the blade profile; (b) the AFC rotor profile; (c) the actual blade.

Figure 5.
Diagram of the test control system.

Figure 6.
The FL-17 wind tunnel: (a) the acoustic wind tunnel and measuring device; (b) the AFC rotor mounted on the test bench.
Figure 6.
The FL-17 wind tunnel: (a) the acoustic wind tunnel and measuring device; (b) the AFC rotor mounted on the test bench.

Figure 7.
The layout of the microphone arrays: (a) the V-shaped bracket microphone array; (b) the arc microphone array.
Figure 7.
The layout of the microphone arrays: (a) the V-shaped bracket microphone array; (b) the arc microphone array.

Figure 8.
The time histories of sound pressure: (a) the original sound pressure; (b) the filtered sound pressure.
Figure 8.
The time histories of sound pressure: (a) the original sound pressure; (b) the filtered sound pressure.

Figure 9.
Data mapping scheme: (a) the distribution of microphone positions; (b) the Lambert projection of microphone positions.
Figure 9.
Data mapping scheme: (a) the distribution of microphone positions; (b) the Lambert projection of microphone positions.

Figure 10.
The repeatability results of noise reduction for Microphone 6, at a 6° lean-back angle, 4P.
Figure 10.
The repeatability results of noise reduction for Microphone 6, at a 6° lean-back angle, 4P.

Figure 11.
The changes in noise for different collective angles under non-AFC controlled hovering: (a) 4°; (b) 6°; (c) 8°; (d) 10°.
Figure 11.
The changes in noise for different collective angles under non-AFC controlled hovering: (a) 4°; (b) 6°; (c) 8°; (d) 10°.

Figure 12.
The change in SPL at 90° azimuth as a function of collective angle.

Figure 13.
The changes in noise for different velocities under non-AFC controlled forward flight: (a) V = 16 m/s; (b) V = 18 m/s; (c) V = 20 m/s; (d) V = 22 m/s.
Figure 13.
The changes in noise for different velocities under non-AFC controlled forward flight: (a) V = 16 m/s; (b) V = 18 m/s; (c) V = 20 m/s; (d) V = 22 m/s.

Figure 14.
Contours of SPL change from the baseline under forward flight, 3P/240°: (a) V = 12 m/s; (b) V = 15 m/s; (c) V = 19 m/s.
Figure 14.
Contours of SPL change from the baseline under forward flight, 3P/240°: (a) V = 12 m/s; (b) V = 15 m/s; (c) V = 19 m/s.

Figure 15.
The changes in noise for different lean-back angles under non-AFC controlled descent, V = 19 m/s: (a) 2°; (b) 3°; (c) 4°; (d) 5°; (e) 6°.
Figure 15.
The changes in noise for different lean-back angles under non-AFC controlled descent, V = 19 m/s: (a) 2°; (b) 3°; (c) 4°; (d) 5°; (e) 6°.

Figure 16.
Contours of SPL change from baseline under oblique descent for different lean-back angles and phase: (a) 5°, , 4P/55°; (b) 5°, , 4P/90°; (c) 6°, , 4P/60°; (d) 6°, , 4P/90°; (e) 7°, , 4P/60°; (f) 7°, , 4P/90°.
Figure 16.
Contours of SPL change from baseline under oblique descent for different lean-back angles and phase: (a) 5°, , 4P/55°; (b) 5°, , 4P/90°; (c) 6°, , 4P/60°; (d) 6°, , 4P/90°; (e) 7°, , 4P/60°; (f) 7°, , 4P/90°.

Figure 17.
Contours of SPL change from baseline under hovering, 0° phase with different frequencies: (a) 1P; (b) 2P; (c) 3P; (d) 4P.
Figure 17.
Contours of SPL change from baseline under hovering, 0° phase with different frequencies: (a) 1P; (b) 2P; (c) 3P; (d) 4P.

Figure 18.
Contours of SPL change from baseline under forward flight, V = 19 m/s, 0° phase with different frequencies: (a) 1P; (b) 2P; (c) 3P; (d) 4P.
Figure 18.
Contours of SPL change from baseline under forward flight, V = 19 m/s, 0° phase with different frequencies: (a) 1P; (b) 2P; (c) 3P; (d) 4P.

Figure 19.
Contours of SPL change from baseline for descent, 6° lean-back angle, 0° phase, with different frequencies: (a) 1P; (b) 2P; (c) 3P; (d) 4P.
Figure 19.
Contours of SPL change from baseline for descent, 6° lean-back angle, 0° phase, with different frequencies: (a) 1P; (b) 2P; (c) 3P; (d) 4P.

Figure 20.
Contours of SPL change from baseline when hovering, 2P with different phases: (a) 0°; (b) 30°; (c) 60°; (d) 90°; (e) 120°; (f) 150°.
Figure 20.
Contours of SPL change from baseline when hovering, 2P with different phases: (a) 0°; (b) 30°; (c) 60°; (d) 90°; (e) 120°; (f) 150°.

Figure 21.
Contours of SPL change from baseline when hovering, 3P with different phases: (a) 0°; (b) 30°; (c) 60°; (d) 90°; (e) 120°; (f) 150°.
Figure 21.
Contours of SPL change from baseline when hovering, 3P with different phases: (a) 0°; (b) 30°; (c) 60°; (d) 90°; (e) 120°; (f) 150°.

Figure 22.
Contours of SPL change from baseline under forward flight, 3P with different phases: (a) 180°; (b) 210°; (c) 240°; (d) 270°; (e) 300°; (f) 330°.
Figure 22.
Contours of SPL change from baseline under forward flight, 3P with different phases: (a) 180°; (b) 210°; (c) 240°; (d) 270°; (e) 300°; (f) 330°.

Figure 23.
Contours of SPL change from baseline for descent, 7° lean-back angle, V = 19 m/s, 4P with different phases: (a) 50°; (b) 60°; (c) 70°; (d) 80°; (e) 90°; (f) 100°.
Figure 23.
Contours of SPL change from baseline for descent, 7° lean-back angle, V = 19 m/s, 4P with different phases: (a) 50°; (b) 60°; (c) 70°; (d) 80°; (e) 90°; (f) 100°.

Figure 24.
SPL (dBA) change from baseline case at Mic 6 of the V-shaped bracket with active flap control at 0–330° phase and lean-back angle of 7°: (a) 1P; (b) 2P; (c) 3P; (d) 4P.
Figure 24.
SPL (dBA) change from baseline case at Mic 6 of the V-shaped bracket with active flap control at 0–330° phase and lean-back angle of 7°: (a) 1P; (b) 2P; (c) 3P; (d) 4P.

Figure 25.
Contours of SPL change from baseline with different TEF configurations, at 5° lean-back angle, V = 18 m/s: (a) inboard TEF only, 4P/60°; (b) inboard TEF only, 4P/120°; (c) outboard TEF only, 4P/60°; (d) outboard TEF only, 4P/120°; (e) dual TEFs, 4P/60°; (f) dual TEFs, 4P/ 120°.
Figure 25.
Contours of SPL change from baseline with different TEF configurations, at 5° lean-back angle, V = 18 m/s: (a) inboard TEF only, 4P/60°; (b) inboard TEF only, 4P/120°; (c) outboard TEF only, 4P/60°; (d) outboard TEF only, 4P/120°; (e) dual TEFs, 4P/60°; (f) dual TEFs, 4P/ 120°.

Figure 26.
SPL (dBA) changes from baseline with different TEF configurations: (a) inboard TEF only; (b) outboard TEF only.
Figure 26.
SPL (dBA) changes from baseline with different TEF configurations: (a) inboard TEF only; (b) outboard TEF only.

Figure 27.
SPL (dBA) change from baseline case at Mic 6 and active flap control at 4P with lean-back angle 7°, V = 18 m/s.
Figure 27.
SPL (dBA) change from baseline case at Mic 6 and active flap control at 4P with lean-back angle 7°, V = 18 m/s.

Figure 28.
Time histories of sound pressure at Mic 6: (a) sound pressure in the 6–8 s time period; (b) sound pressure generated by three blades during a period of oblique descent.
Figure 28.
Time histories of sound pressure at Mic 6: (a) sound pressure in the 6–8 s time period; (b) sound pressure generated by three blades during a period of oblique descent.

Figure 29.
Measured SPL (dBA) from the V-shaped bracket for the baseline case and with active flap control at 4P, lean-back angle 7°, V = 18 m/s.
Figure 29.
Measured SPL (dBA) from the V-shaped bracket for the baseline case and with active flap control at 4P, lean-back angle 7°, V = 18 m/s.


Table 1.
Rotor characteristics and operating condition.
| Rotor | |
|---|---|
| Hub type | hingeless |
| Rotor radius, R | 1.5 m |
| Blade chord length, c | 0.13 m |
| Airfoil | OA312 |
| Tip Taper | 1:3, from 0.941R |
| Twist | 10° at 0.25R, −2° at 0.933R |
| Solidity | 0.1013 |
| Rotation speed | 808 rpm |
| Collective range | 0~15° |
| Lateral cyclic range | −10~10° |
| Long cyclic range | −10~10° |
| TEFs | |
| Chord length | 0.154c |
| Span length | 0.1R |
| Mid-span locations | Inboard: 0.737R Outboard: 0.85R |
| Frequency | 0~4 rev |
| Amplitude | 0~5.5° |
Disclaimer/Publisher’s Note: The statements, opinions and data contained in all publications are solely those of the individual author(s) and contributor(s) and not of MDPI and/or the editor(s). MDPI and/or the editor(s) disclaim responsibility for any injury to people or property resulting from any ideas, methods, instructions or products referred to in the content. |
© 2023 by the authors. Licensee MDPI, Basel, Switzerland. This article is an open access article distributed under the terms and conditions of the Creative Commons Attribution (CC BY) license (https://creativecommons.org/licenses/by/4.0/).
Share and Cite
MDPI and ACS Style
Hu, Z.; Liu, Y.; Shi, Y.; Xu, G. An Experimental Study on Rotor Aerodynamic Noise Control Based on Active Flap Control. Aerospace 2023, 10, 121. https://doi.org/10.3390/aerospace10020121
AMA Style
Hu Z, Liu Y, Shi Y, Xu G. An Experimental Study on Rotor Aerodynamic Noise Control Based on Active Flap Control. Aerospace. 2023; 10(2):121. https://doi.org/10.3390/aerospace10020121
Chicago/Turabian StyleHu, Zhiyuan, Yang Liu, Yongjie Shi, and Guohua Xu. 2023. "An Experimental Study on Rotor Aerodynamic Noise Control Based on Active Flap Control" Aerospace 10, no. 2: 121. https://doi.org/10.3390/aerospace10020121
Note that from the first issue of 2016, this journal uses article numbers instead of page numbers. See further details here.