


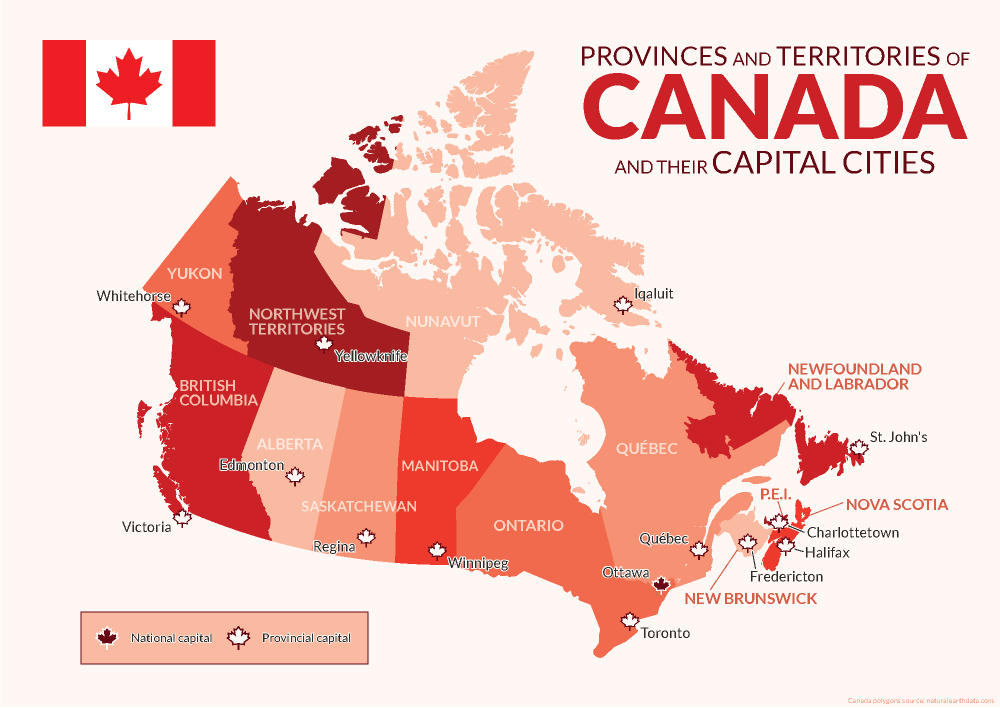
Avenza was founded and headquartered in Toronto, and as such, we pride ourselves on being a Canadian company with a global reach. This year we have celebrated by creating a map highlighting the names and capital cities of each province and territory of Canada using MAPublisher.
Using the MAP Point Plotter Tool to Plot Canadian Capital Cities
This blog will detail how we quickly and easily plotted points to represent the capital cities of Canada and its provinces and territories using the MAP Point Plotter tool. Firstly, a MAP Point layer must be created and selected before opening the MAP Point Plotter tool. This is the only layer type that can be used with this tool, for obvious reasons.
There are several different ways in which addresses and coordinates can be entered into the MAP Point Plotter tool. This blog will highlight a few of the common techniques.
Using a Point’s Address
The simplest way to plot a point is by entering its address, following a specific-to-general granularity format as seen in the examples below. After opening the tool, the Address tab was selected and the following cities were plotted using MapQuest to locate these addresses:
- Victoria: 1 Centennial Square, Victoria, BC V8W 1P6
- Edmonton: Edmonton, AB T5J 0R2
- Regina: 2476 Victoria Ave, Regina, SK
- Winnipeg: 510 Main Street, Winnipeg

Using a Point’s Coordinates in Decimal Degrees
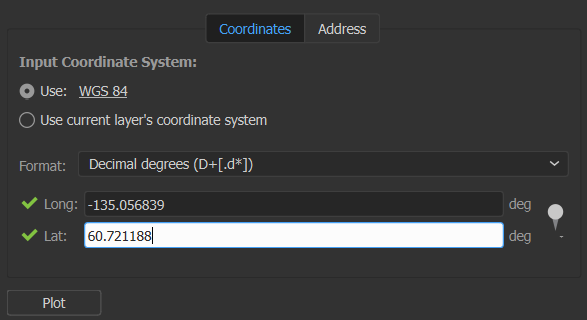
Another way to plot points is to use coordinates, by selecting the Coordinates tab. There are several different coordinate formats accepted by the MAP Point Plotter tool. We entered simple decimal degrees by selecting Decimal degrees as the format and using these coordinates:
- Whitehorse: Long: -135.056839, Lat: 60.721188
- Yellowknife: Long: -114.371788, Lat: 62.453972
- Iqaluit: Long: -68.519722, Lat: 63.748611
Decimal degrees with a compass direction can be entered similarly to the previous step by using negative or positive numbers to indicate the hemisphere of the point or the compass direction can be indicated by using a letter. The follow cities were added to the map in this manner:
- Toronto: 43.6532° N, 79.3832° W → Long: -79.3832, Lat: 43.6532
- Québec: 46.8139° N, 71.2080° W → Long: -71.2080, Lat: 46.8139
- St. John’s: 47.5615° N, 52.7126° W → Long: 52.7126W, Lat: 47.5615N
Using a Point’s Coordinates in Degrees Minutes Seconds
Coordinates that are formatted as Degrees Minutes Seconds, can be added using various delimiters, such as spaces, dashes, underscores, colons, or d (degree), single quote (minute), double quote (second). We entered the last 3 provincial capital cities using these formats:
- Halifax: 44° 39′ 3.8520″, -63° 34′ 57.6732″ → Long: 063 34 57.6732W, Lat: 44 39 3.8520N
- Charlottetown: 46° 14′ 19.9968″, -63° 7′ 44.9976″ → Long: -63-07-44.9976, Lat: 46-14-19.9968
- Fredericton: 45° 57′ 53.9748″, -66° 38′ 46.7952″ → Long: 066d38’46.7952″W Lat: 45d57’53.9748″N
Using MAP Locations to Plot a Point
Points can also be plotted from previously created MAP Locations (to learn about this tool, visit the MAP Locations page in our Support Centre). This is how we plotted a MAP Location for Ottawa on our map. In the MAP Point Plotter tool window, we selected the hamburger menu and selected Plot MAP Locations. Then we selected our MAP Location for Ottawa and set the Destination Layer to Existing… and added it to the Capitals MAP Point Layer. After clicking OK the point was added to our map!

Finally, we used other MAPublisher finishing tools to stylize and complete our map so it would be ready to post on this blog just in time for Canada Day!
For more information about the MAP Point Plotter tool, check out its documentation page in our Support Centre!