Introducing the "Guide to Creating a DFD for Student Information System". This concise article provides essential steps and concepts to design an effective student management system data flow diagram. Whether you're a student, educator, or system analyst, this resource empowers you to visualize and comprehend the information flow within an educational institution's database system.
In this article
Understanding DFD For Student Information System
A Student Information System Data Flow Diagram (DFD) is a visual representation that illustrates how information flows within the SIS. It outlines the processes, data sources, data destinations, and data storage involved in managing student information. The DFD helps in understanding the interactions between different components of the SIS and serves as a blueprint for system development, modification, or optimization.
It streamlines enrollment, tracks academic progress, and facilitates communication between stakeholders. Student Information System DFD ensures accurate record-keeping, supports assessment and grading, and provides valuable insights through reporting and analytics.
Levels of DFD for Student Information System
Before you learn about how to create a student management system data flow diagram, it's essential to understand that DFDs are visual representations of how data moves within the system. Each level provides a progressively detailed view, from the high-level overview in the Context Diagram to the finer-grained processes in Level 2.
Let's explore each level in detail.
Context Diagram (Level 0):
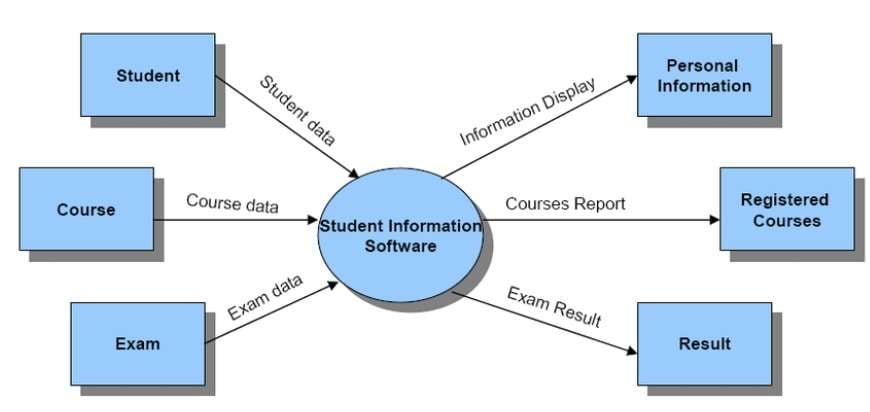
The Context Diagram, or Level 0 DFD, provides a high-level view of the Student Information System (SIS). It depicts the system as a single process and shows external entities, such as users, interacting with it. This diagram establishes the boundary of the SIS, making it clear what inputs and outputs are relevant to the system.
DFD Level 1:
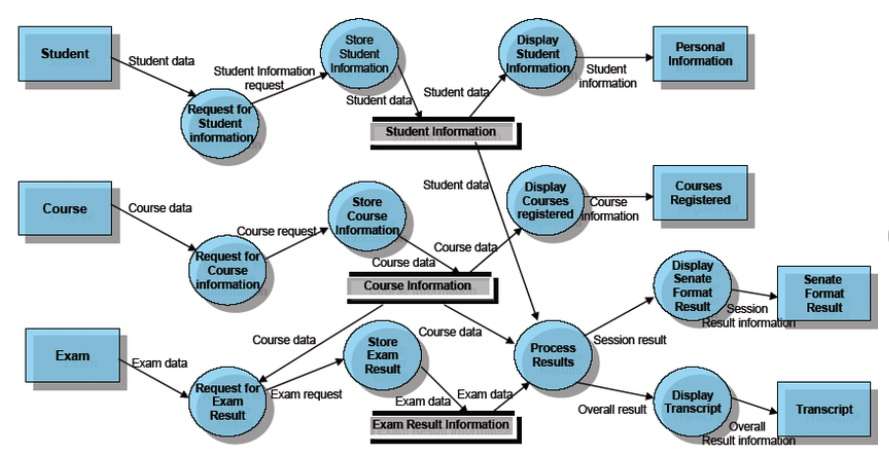
The Level 1 DFD delves deeper into the student management system data flow diagram, breaking down the single process from the Context Diagram into sub-processes. It identifies major processes and their interactions within the system. At this level, external entities are still represented, but the focus shifts towards illustrating the internal functions and data flows of the SIS.
DFD Level 2:
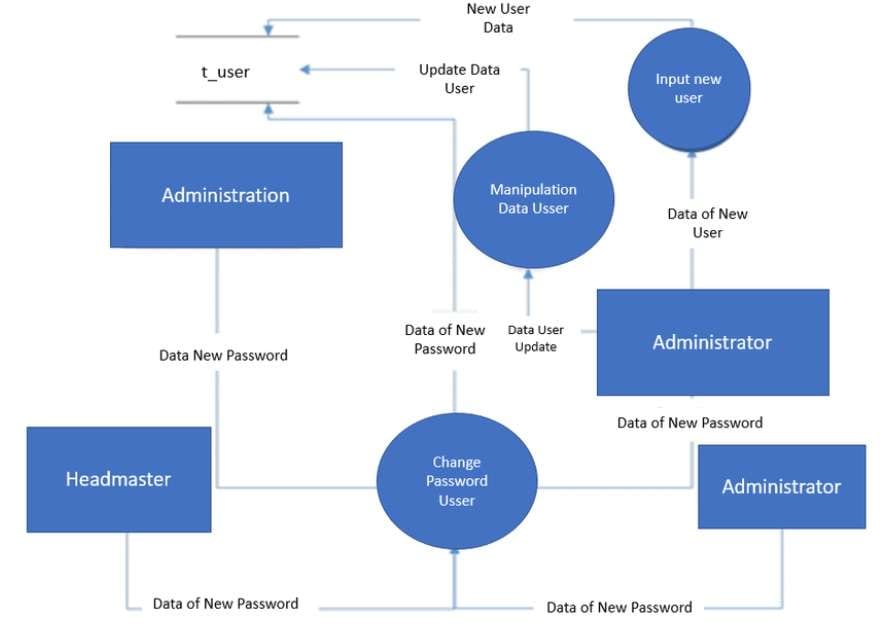
Level 2 DFD further decomposes the processes identified in Level 1. It provides a more detailed view of each sub-process, breaking them down into finer-grained tasks or functions. This level may also involve additional external entities and data stores specific to the sub-processes. It offers a more granular understanding of how data moves and is processed within the system.
Use Wondershare Endrawmax to Create a Student Information System Flowchart
Using Wondershare EdrawMax to create a Student Information System (SIS) flowchart is highly advantageous due to its user-friendly interface and intuitive design. It streamlines the diagram creation process, ensuring that both novice and experienced users can easily navigate the software.
With its extensive library of templates and symbols, EdrawMax offers a wide range of pre-designed elements that can be customized to suit specific requirements. This rich resource pool accelerates the flowcharting process, allowing users to efficiently represent the complex processes within an SIS.
EdrawMax significantly enhances productivity by providing a seamless workflow for users. The drag-and-drop functionality simplifies the placement and arrangement of flowchart elements, enabling swift creation without the need for advanced technical expertise.
Here are the steps to create a dfd for a student information system using Wondershare EdrawMax:
Step 1: Launch EdrawMax software on your computer to begin creating the Student Information System flowchart.
Step 2: Click "File" > "New" and choose "Flowchart" as your diagram type to initiate the project. Opt for a pre-designed template or start from scratch based on your preference and project requirements.
Step 3: Use the flowchart symbols and shapes from the left panel. Drag and drop them onto the canvas to represent processes and actions. Utilize connector lines to link the shapes, indicating the flow of information within the Student Information System.
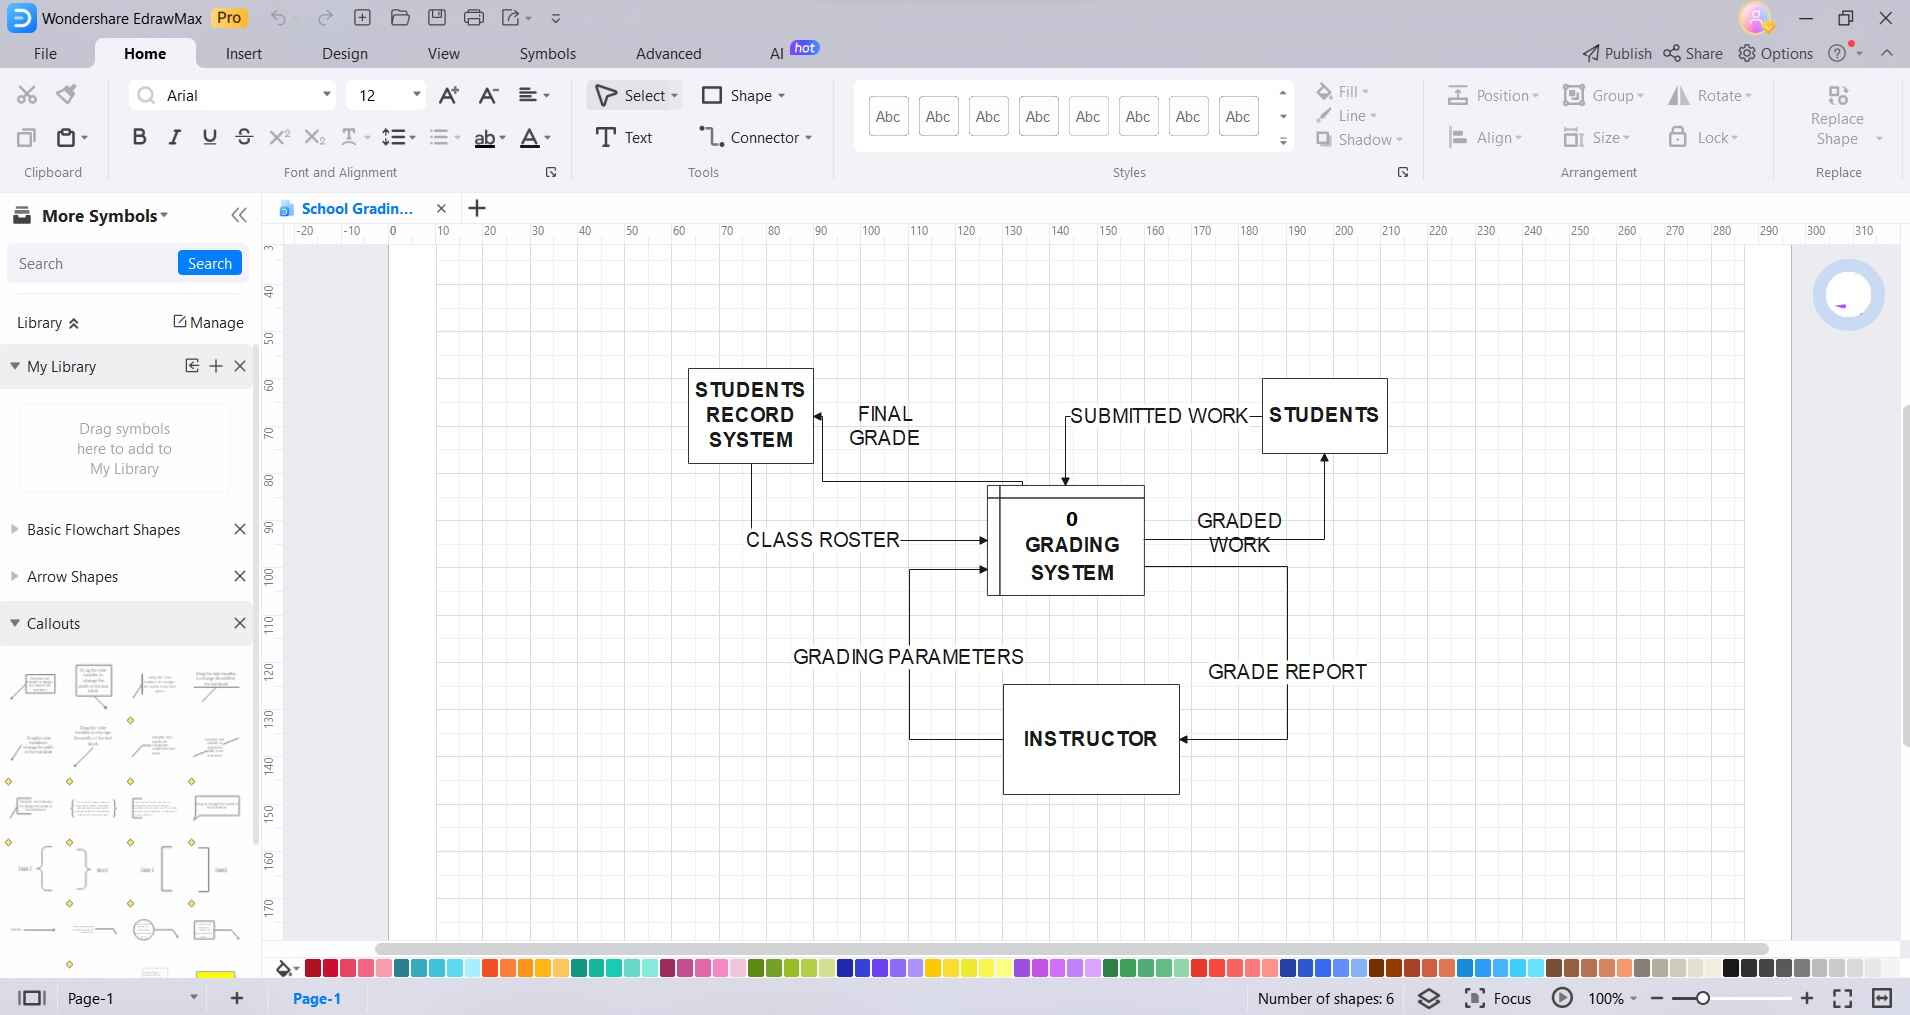
Step 4: Label each shape with relevant information, such as process names, data inputs, and outputs.

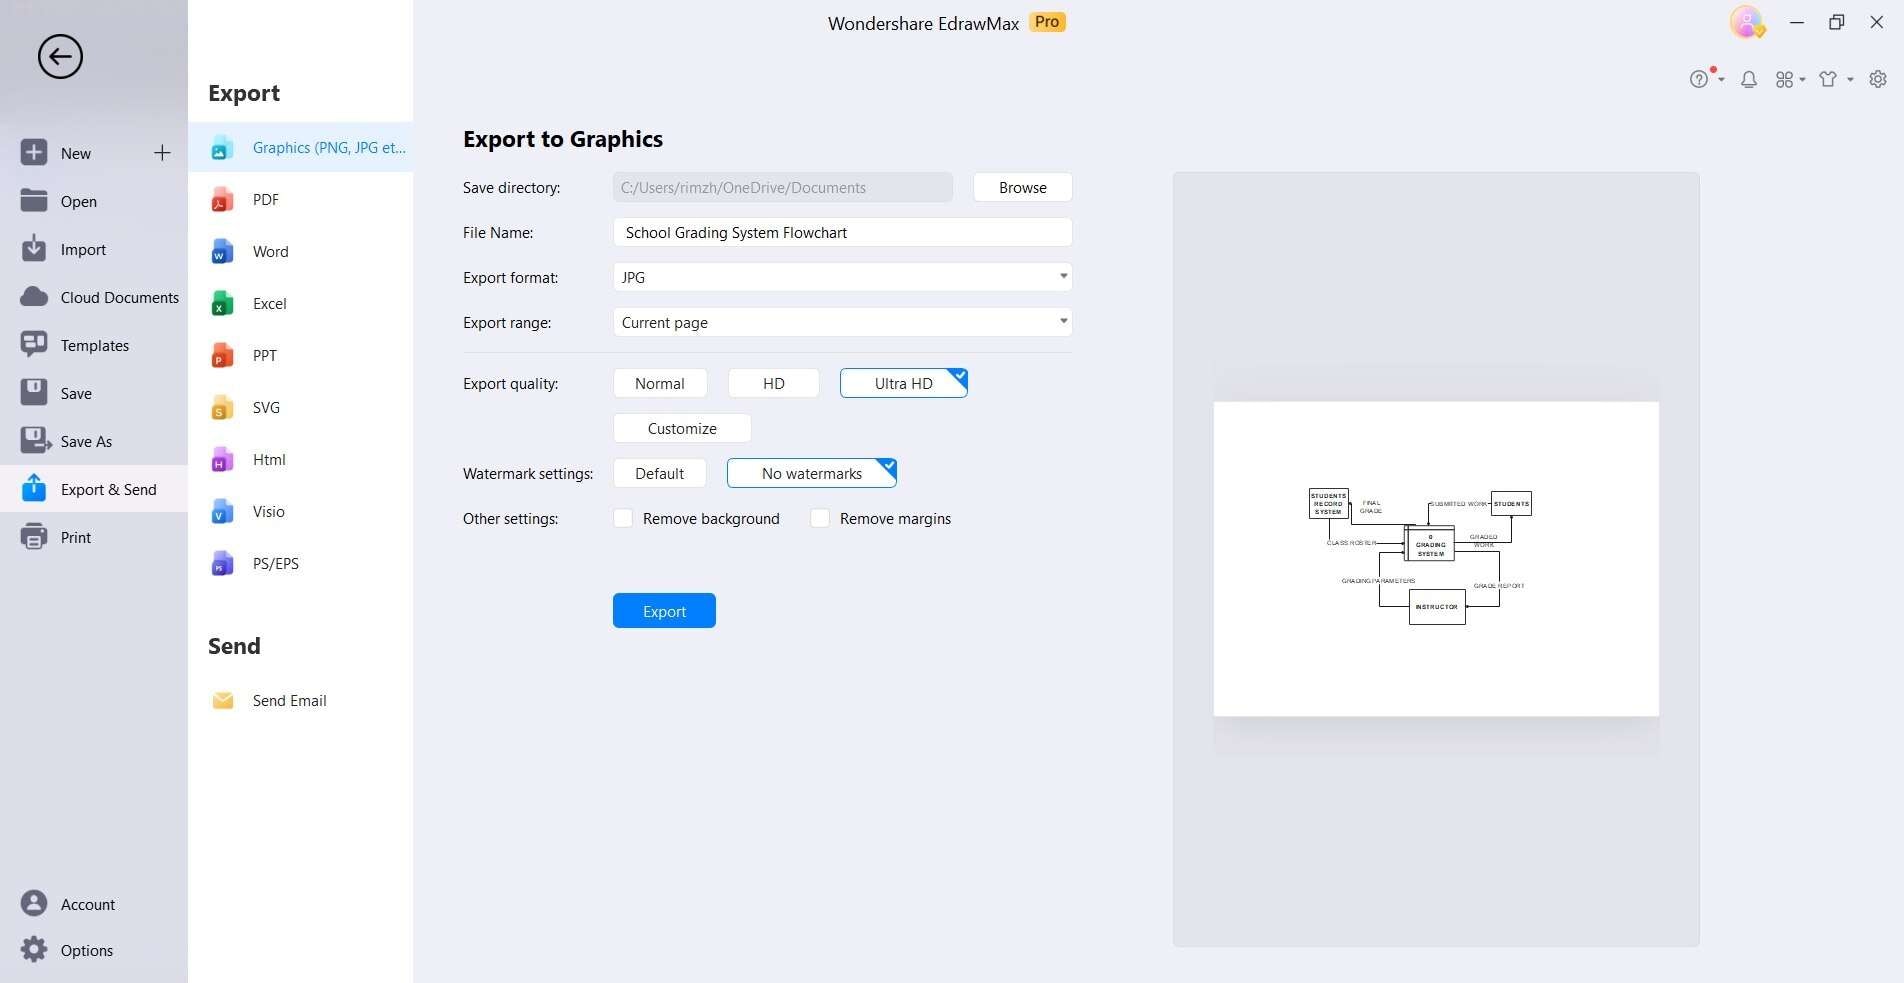
Step 5: Once complete, save your flowchart in a suitable format for easy sharing and future reference.
Conclusion
In conclusion, this guide has provided a comprehensive roadmap for crafting a student management system data flow diagram. By understanding the system's components, and levels of DFD, and utilizing tools like Wondershare EdrawMax, users can effectively depict information flow within educational institutions.
With this knowledge, optimizing SIS functionality becomes a tangible and attainable goal.
FAQs
1. What is the DFD of a school management system?
The DFD of a school management system is a visual representation illustrating how information flows within the system. It showcases processes like enrollment, attendance tracking, grading, and administrative functions, demonstrating how data moves through the system.
2. How many processes are there in level 1 DFD?
Level 1 DFD typically consists of several major processes within a system. The exact number of processes can vary depending on the complexity and specific functionalities of the school management system being depicted.
3. What are the phases of DFD?
The phases of creating a DFD include: 1) Identifying the system's boundaries and external entities, 2) Identifying main processes and data flows, 3) Decomposing processes into detailed sub-processes (if needed), and 4) Ensuring data stores and external entities are properly connected for accurate information flow representation.