WO2013103902A1 - Dpa-enriched compositions of omega-3 polyunsaturated fatty acids in free acid form - Google Patents
Dpa-enriched compositions of omega-3 polyunsaturated fatty acids in free acid form Download PDFInfo
- Publication number
- WO2013103902A1 WO2013103902A1 PCT/US2013/020398 US2013020398W WO2013103902A1 WO 2013103902 A1 WO2013103902 A1 WO 2013103902A1 US 2013020398 W US2013020398 W US 2013020398W WO 2013103902 A1 WO2013103902 A1 WO 2013103902A1
- Authority
- WO
- WIPO (PCT)
- Prior art keywords
- amount
- pharmaceutical composition
- epa
- dha
- present
- Prior art date
Links
- 239000002253 acid Substances 0.000 title claims abstract description 63
- 235000020660 omega-3 fatty acid Nutrition 0.000 title claims description 82
- 239000000203 mixture Substances 0.000 title abstract description 214
- 239000008194 pharmaceutical composition Substances 0.000 claims abstract description 179
- 238000000034 method Methods 0.000 claims abstract description 95
- 235000020777 polyunsaturated fatty acids Nutrition 0.000 claims abstract description 71
- 229940121710 HMGCoA reductase inhibitor Drugs 0.000 claims abstract description 51
- 238000002560 therapeutic procedure Methods 0.000 claims abstract description 32
- 230000008569 process Effects 0.000 claims abstract description 28
- 208000006575 hypertriglyceridemia Diseases 0.000 claims abstract description 17
- 235000021323 fish oil Nutrition 0.000 claims abstract description 12
- YZXBAPSDXZZRGB-DOFZRALJSA-N arachidonic acid Chemical compound CCCCC\C=C/C\C=C/C\C=C/C\C=C/CCCC(O)=O YZXBAPSDXZZRGB-DOFZRALJSA-N 0.000 claims description 228
- XSQUKJJJFZCRTK-UHFFFAOYSA-N Urea Chemical compound NC(N)=O XSQUKJJJFZCRTK-UHFFFAOYSA-N 0.000 claims description 123
- 235000021342 arachidonic acid Nutrition 0.000 claims description 111
- 229940114079 arachidonic acid Drugs 0.000 claims description 111
- UFTFJSFQGQCHQW-UHFFFAOYSA-N triformin Chemical compound O=COCC(OC=O)COC=O UFTFJSFQGQCHQW-UHFFFAOYSA-N 0.000 claims description 88
- 239000004202 carbamide Substances 0.000 claims description 64
- 238000002203 pretreatment Methods 0.000 claims description 62
- 125000004494 ethyl ester group Chemical group 0.000 claims description 54
- 239000002775 capsule Substances 0.000 claims description 47
- 238000010668 complexation reaction Methods 0.000 claims description 40
- 239000002552 dosage form Substances 0.000 claims description 39
- 210000002966 serum Anatomy 0.000 claims description 36
- 108010010803 Gelatin Proteins 0.000 claims description 27
- 239000008273 gelatin Substances 0.000 claims description 27
- 229920000159 gelatin Polymers 0.000 claims description 27
- 235000019322 gelatine Nutrition 0.000 claims description 27
- 235000011852 gelatine desserts Nutrition 0.000 claims description 27
- 235000020665 omega-6 fatty acid Nutrition 0.000 claims description 25
- 239000007903 gelatin capsule Substances 0.000 claims description 24
- 238000004519 manufacturing process Methods 0.000 claims description 20
- -1 poly(acrylate-methylmethacrylate) copolymer Polymers 0.000 claims description 20
- 150000003626 triacylglycerols Chemical class 0.000 claims description 20
- JOYRKODLDBILNP-UHFFFAOYSA-N Ethyl urethane Chemical compound CCOC(N)=O JOYRKODLDBILNP-UHFFFAOYSA-N 0.000 claims description 13
- XLYOFNOQVPJJNP-UHFFFAOYSA-N water Chemical compound O XLYOFNOQVPJJNP-UHFFFAOYSA-N 0.000 claims description 13
- RYMZZMVNJRMUDD-HGQWONQESA-N simvastatin Chemical compound C([C@H]1[C@@H](C)C=CC2=C[C@H](C)C[C@@H]([C@H]12)OC(=O)C(C)(C)CC)C[C@@H]1C[C@@H](O)CC(=O)O1 RYMZZMVNJRMUDD-HGQWONQESA-N 0.000 claims description 9
- RYMZZMVNJRMUDD-UHFFFAOYSA-N SJ000286063 Natural products C12C(OC(=O)C(C)(C)CC)CC(C)C=C2C=CC(C)C1CCC1CC(O)CC(=O)O1 RYMZZMVNJRMUDD-UHFFFAOYSA-N 0.000 claims description 8
- 230000006872 improvement Effects 0.000 claims description 8
- 229960002855 simvastatin Drugs 0.000 claims description 8
- 239000008213 purified water Substances 0.000 claims description 7
- 238000003860 storage Methods 0.000 claims description 7
- 239000011248 coating agent Substances 0.000 claims description 6
- 238000000576 coating method Methods 0.000 claims description 6
- 229960000672 rosuvastatin Drugs 0.000 claims description 6
- BPRHUIZQVSMCRT-VEUZHWNKSA-N rosuvastatin Chemical compound CC(C)C1=NC(N(C)S(C)(=O)=O)=NC(C=2C=CC(F)=CC=2)=C1\C=C\[C@@H](O)C[C@@H](O)CC(O)=O BPRHUIZQVSMCRT-VEUZHWNKSA-N 0.000 claims description 6
- XUKUURHRXDUEBC-KAYWLYCHSA-N Atorvastatin Chemical compound C=1C=CC=CC=1C1=C(C=2C=CC(F)=CC=2)N(CC[C@@H](O)C[C@@H](O)CC(O)=O)C(C(C)C)=C1C(=O)NC1=CC=CC=C1 XUKUURHRXDUEBC-KAYWLYCHSA-N 0.000 claims description 4
- XUKUURHRXDUEBC-UHFFFAOYSA-N Atorvastatin Natural products C=1C=CC=CC=1C1=C(C=2C=CC(F)=CC=2)N(CCC(O)CC(O)CC(O)=O)C(C(C)C)=C1C(=O)NC1=CC=CC=C1 XUKUURHRXDUEBC-UHFFFAOYSA-N 0.000 claims description 4
- 229960005370 atorvastatin Drugs 0.000 claims description 4
- 230000037406 food intake Effects 0.000 claims description 4
- FJLGEFLZQAZZCD-MCBHFWOFSA-N (3R,5S)-fluvastatin Chemical compound C12=CC=CC=C2N(C(C)C)C(\C=C\[C@@H](O)C[C@@H](O)CC(O)=O)=C1C1=CC=C(F)C=C1 FJLGEFLZQAZZCD-MCBHFWOFSA-N 0.000 claims description 2
- PCZOHLXUXFIOCF-UHFFFAOYSA-N Monacolin X Natural products C12C(OC(=O)C(C)CC)CC(C)C=C2C=CC(C)C1CCC1CC(O)CC(=O)O1 PCZOHLXUXFIOCF-UHFFFAOYSA-N 0.000 claims description 2
- TUZYXOIXSAXUGO-UHFFFAOYSA-N Pravastatin Natural products C1=CC(C)C(CCC(O)CC(O)CC(O)=O)C2C(OC(=O)C(C)CC)CC(O)C=C21 TUZYXOIXSAXUGO-UHFFFAOYSA-N 0.000 claims description 2
- 230000001419 dependent effect Effects 0.000 claims description 2
- 239000002702 enteric coating Substances 0.000 claims description 2
- 238000009505 enteric coating Methods 0.000 claims description 2
- 229960003765 fluvastatin Drugs 0.000 claims description 2
- 229960004844 lovastatin Drugs 0.000 claims description 2
- PCZOHLXUXFIOCF-BXMDZJJMSA-N lovastatin Chemical compound C([C@H]1[C@@H](C)C=CC2=C[C@H](C)C[C@@H]([C@H]12)OC(=O)[C@@H](C)CC)C[C@@H]1C[C@@H](O)CC(=O)O1 PCZOHLXUXFIOCF-BXMDZJJMSA-N 0.000 claims description 2
- QLJODMDSTUBWDW-UHFFFAOYSA-N lovastatin hydroxy acid Natural products C1=CC(C)C(CCC(O)CC(O)CC(O)=O)C2C(OC(=O)C(C)CC)CC(C)C=C21 QLJODMDSTUBWDW-UHFFFAOYSA-N 0.000 claims description 2
- 229960002797 pitavastatin Drugs 0.000 claims description 2
- VGYFMXBACGZSIL-MCBHFWOFSA-N pitavastatin Chemical compound OC(=O)C[C@H](O)C[C@H](O)\C=C\C1=C(C2CC2)N=C2C=CC=CC2=C1C1=CC=C(F)C=C1 VGYFMXBACGZSIL-MCBHFWOFSA-N 0.000 claims description 2
- 229960002965 pravastatin Drugs 0.000 claims description 2
- TUZYXOIXSAXUGO-PZAWKZKUSA-N pravastatin Chemical compound C1=C[C@H](C)[C@H](CC[C@@H](O)C[C@@H](O)CC(O)=O)[C@H]2[C@@H](OC(=O)[C@@H](C)CC)C[C@H](O)C=C21 TUZYXOIXSAXUGO-PZAWKZKUSA-N 0.000 claims description 2
- 238000011282 treatment Methods 0.000 abstract description 129
- 230000007423 decrease Effects 0.000 abstract description 19
- 238000007670 refining Methods 0.000 abstract description 14
- 229940127218 antiplatelet drug Drugs 0.000 abstract description 3
- 239000000106 platelet aggregation inhibitor Substances 0.000 abstract description 3
- MBMBGCFOFBJSGT-KUBAVDMBSA-N all-cis-docosa-4,7,10,13,16,19-hexaenoic acid Chemical compound CC\C=C/C\C=C/C\C=C/C\C=C/C\C=C/C\C=C/CCC(O)=O MBMBGCFOFBJSGT-KUBAVDMBSA-N 0.000 description 387
- JAZBEHYOTPTENJ-JLNKQSITSA-N all-cis-5,8,11,14,17-icosapentaenoic acid Chemical compound CC\C=C/C\C=C/C\C=C/C\C=C/C\C=C/CCCC(O)=O JAZBEHYOTPTENJ-JLNKQSITSA-N 0.000 description 222
- 235000020673 eicosapentaenoic acid Nutrition 0.000 description 220
- 229960005135 eicosapentaenoic acid Drugs 0.000 description 220
- JAZBEHYOTPTENJ-UHFFFAOYSA-N eicosapentaenoic acid Natural products CCC=CCC=CCC=CCC=CCC=CCCCC(O)=O JAZBEHYOTPTENJ-UHFFFAOYSA-N 0.000 description 219
- YUFFSWGQGVEMMI-JLNKQSITSA-N (7Z,10Z,13Z,16Z,19Z)-docosapentaenoic acid Chemical compound CC\C=C/C\C=C/C\C=C/C\C=C/C\C=C/CCCCCC(O)=O YUFFSWGQGVEMMI-JLNKQSITSA-N 0.000 description 200
- 235000020669 docosahexaenoic acid Nutrition 0.000 description 195
- 235000021294 Docosapentaenoic acid Nutrition 0.000 description 193
- 229940090949 docosahexaenoic acid Drugs 0.000 description 192
- QIQSYARFOIKJJR-LUTWCBITSA-N (4z,7z,10z,13z,16z,19z)-docosa-4,7,10,13,16,19-hexaenoic acid;(4z,7z,10z,13z,16z)-docosa-4,7,10,13,16-pentaenoic acid;(7z,10z,13z,16z,19z)-docosa-7,10,13,16,19-pentaenoic acid;(6z,9z,12z,15z,18z)-henicosa-6,9,12,15,18-pentaenoic acid;(5z,8z,11z,14z,17z)-i Chemical compound CCCCC\C=C/C\C=C/CCCCCCCC(O)=O.CCCCC\C=C/C\C=C/C\C=C/CCCCC(O)=O.CC\C=C/C\C=C/C\C=C/CCCCCCCC(O)=O.CC\C=C/C\C=C/C\C=C/C\C=C/CCCCCCC(O)=O.CC\C=C/C\C=C/C\C=C/C\C=C/C\C=C/CCCC(O)=O.CC\C=C/C\C=C/C\C=C/C\C=C/C\C=C/CCCCC(O)=O.CCCCC\C=C/C\C=C/C\C=C/C\C=C/C\C=C/CCC(O)=O.CC\C=C/C\C=C/C\C=C/C\C=C/C\C=C/CCCCCC(O)=O.CC\C=C/C\C=C/C\C=C/C\C=C/C\C=C/C\C=C/CCC(O)=O QIQSYARFOIKJJR-LUTWCBITSA-N 0.000 description 142
- 229940035000 epanova Drugs 0.000 description 142
- 230000008859 change Effects 0.000 description 100
- DTMGIJFHGGCSLO-FIAQIACWSA-N ethyl (4z,7z,10z,13z,16z,19z)-docosa-4,7,10,13,16,19-hexaenoate;ethyl (5z,8z,11z,14z,17z)-icosa-5,8,11,14,17-pentaenoate Chemical compound CCOC(=O)CCC\C=C/C\C=C/C\C=C/C\C=C/C\C=C/CC.CCOC(=O)CC\C=C/C\C=C/C\C=C/C\C=C/C\C=C/C\C=C/CC DTMGIJFHGGCSLO-FIAQIACWSA-N 0.000 description 87
- 229940115970 lovaza Drugs 0.000 description 87
- 241000894007 species Species 0.000 description 79
- 108090000623 proteins and genes Proteins 0.000 description 67
- 230000036470 plasma concentration Effects 0.000 description 55
- 108010023302 HDL Cholesterol Proteins 0.000 description 54
- 235000014113 dietary fatty acids Nutrition 0.000 description 47
- 230000000694 effects Effects 0.000 description 47
- 229930195729 fatty acid Natural products 0.000 description 47
- 239000000194 fatty acid Substances 0.000 description 47
- 150000004665 fatty acids Chemical class 0.000 description 40
- HVYWMOMLDIMFJA-DPAQBDIFSA-N cholesterol Chemical compound C1C=C2C[C@@H](O)CC[C@]2(C)[C@@H]2[C@@H]1[C@@H]1CC[C@H]([C@H](C)CCCC(C)C)[C@@]1(C)CC2 HVYWMOMLDIMFJA-DPAQBDIFSA-N 0.000 description 34
- 230000009467 reduction Effects 0.000 description 34
- 230000014509 gene expression Effects 0.000 description 32
- 239000003925 fat Substances 0.000 description 31
- 102000030169 Apolipoprotein C-III Human genes 0.000 description 29
- 108010056301 Apolipoprotein C-III Proteins 0.000 description 29
- 108010028554 LDL Cholesterol Proteins 0.000 description 29
- LFQSCWFLJHTTHZ-UHFFFAOYSA-N Ethanol Chemical compound CCO LFQSCWFLJHTTHZ-UHFFFAOYSA-N 0.000 description 27
- 235000004213 low-fat Nutrition 0.000 description 26
- 230000000052 comparative effect Effects 0.000 description 24
- SSQPWTVBQMWLSZ-AAQCHOMXSA-N ethyl (5Z,8Z,11Z,14Z,17Z)-icosapentaenoate Chemical compound CCOC(=O)CCC\C=C/C\C=C/C\C=C/C\C=C/C\C=C/CC SSQPWTVBQMWLSZ-AAQCHOMXSA-N 0.000 description 23
- HOBAELRKJCKHQD-UHFFFAOYSA-N (8Z,11Z,14Z)-8,11,14-eicosatrienoic acid Natural products CCCCCC=CCC=CCC=CCCCCCCC(O)=O HOBAELRKJCKHQD-UHFFFAOYSA-N 0.000 description 22
- HOBAELRKJCKHQD-QNEBEIHSSA-N dihomo-γ-linolenic acid Chemical compound CCCCC\C=C/C\C=C/C\C=C/CCCCCCC(O)=O HOBAELRKJCKHQD-QNEBEIHSSA-N 0.000 description 22
- 229920000064 Ethyl eicosapentaenoic acid Polymers 0.000 description 20
- 230000004044 response Effects 0.000 description 19
- 235000015263 low fat diet Nutrition 0.000 description 18
- 239000002245 particle Substances 0.000 description 16
- JIWBIWFOSCKQMA-UHFFFAOYSA-N stearidonic acid Natural products CCC=CCC=CCC=CCC=CCCCCC(O)=O JIWBIWFOSCKQMA-UHFFFAOYSA-N 0.000 description 16
- OYHQOLUKZRVURQ-HZJYTTRNSA-N Linoleic acid Chemical compound CCCCC\C=C/C\C=C/CCCCCCCC(O)=O OYHQOLUKZRVURQ-HZJYTTRNSA-N 0.000 description 15
- JIWBIWFOSCKQMA-LTKCOYKYSA-N all-cis-octadeca-6,9,12,15-tetraenoic acid Chemical compound CC\C=C/C\C=C/C\C=C/C\C=C/CCCCC(O)=O JIWBIWFOSCKQMA-LTKCOYKYSA-N 0.000 description 15
- 210000004369 blood Anatomy 0.000 description 15
- 239000008280 blood Substances 0.000 description 15
- VZCCETWTMQHEPK-UHFFFAOYSA-N gamma-Linolensaeure Natural products CCCCCC=CCC=CCC=CCCCCC(O)=O VZCCETWTMQHEPK-UHFFFAOYSA-N 0.000 description 15
- VZCCETWTMQHEPK-QNEBEIHSSA-N gamma-linolenic acid Chemical compound CCCCC\C=C/C\C=C/C\C=C/CCCCC(O)=O VZCCETWTMQHEPK-QNEBEIHSSA-N 0.000 description 15
- 235000020664 gamma-linolenic acid Nutrition 0.000 description 15
- 229960002733 gamolenic acid Drugs 0.000 description 15
- XSXIVVZCUAHUJO-AVQMFFATSA-N (11e,14e)-icosa-11,14-dienoic acid Chemical compound CCCCC\C=C\C\C=C\CCCCCCCCCC(O)=O XSXIVVZCUAHUJO-AVQMFFATSA-N 0.000 description 14
- 235000021297 Eicosadienoic acid Nutrition 0.000 description 14
- 235000012054 meals Nutrition 0.000 description 14
- 230000002829 reductive effect Effects 0.000 description 14
- OQOCQFSPEWCSDO-JLNKQSITSA-N 6Z,9Z,12Z,15Z,18Z-Heneicosapentaenoic acid Chemical compound CC\C=C/C\C=C/C\C=C/C\C=C/C\C=C/CCCCC(O)=O OQOCQFSPEWCSDO-JLNKQSITSA-N 0.000 description 13
- 238000013461 design Methods 0.000 description 13
- ITNKVODZACVXDS-YNUSHXQLSA-N ethyl (4Z,7Z,10Z,13Z,16Z,19Z)-docosahexaenoate Chemical compound CCOC(=O)CC\C=C/C\C=C/C\C=C/C\C=C/C\C=C/C\C=C/CC ITNKVODZACVXDS-YNUSHXQLSA-N 0.000 description 13
- 235000019197 fats Nutrition 0.000 description 13
- 235000020778 linoleic acid Nutrition 0.000 description 13
- OYHQOLUKZRVURQ-IXWMQOLASA-N linoleic acid Natural products CCCCC\C=C/C\C=C\CCCCCCCC(O)=O OYHQOLUKZRVURQ-IXWMQOLASA-N 0.000 description 13
- 230000037356 lipid metabolism Effects 0.000 description 13
- AHANXAKGNAKFSK-PDBXOOCHSA-N all-cis-icosa-11,14,17-trienoic acid Chemical compound CC\C=C/C\C=C/C\C=C/CCCCCCCCCC(O)=O AHANXAKGNAKFSK-PDBXOOCHSA-N 0.000 description 12
- 235000012000 cholesterol Nutrition 0.000 description 12
- 239000003814 drug Substances 0.000 description 12
- PRHHYVQTPBEDFE-UHFFFAOYSA-N eicosatrienoic acid Natural products CCCCCC=CCC=CCCCCC=CCCCC(O)=O PRHHYVQTPBEDFE-UHFFFAOYSA-N 0.000 description 12
- 150000002632 lipids Chemical class 0.000 description 12
- 230000001105 regulatory effect Effects 0.000 description 12
- 108010007622 LDL Lipoproteins Proteins 0.000 description 11
- 229940079593 drug Drugs 0.000 description 11
- 235000021588 free fatty acids Nutrition 0.000 description 11
- 235000008390 olive oil Nutrition 0.000 description 11
- 239000004006 olive oil Substances 0.000 description 11
- 239000000902 placebo Substances 0.000 description 11
- 229940068196 placebo Drugs 0.000 description 11
- DTOSIQBPPRVQHS-PDBXOOCHSA-N alpha-linolenic acid Chemical compound CC\C=C/C\C=C/C\C=C/CCCCCCCC(O)=O DTOSIQBPPRVQHS-PDBXOOCHSA-N 0.000 description 10
- 238000000338 in vitro Methods 0.000 description 10
- 102000018616 Apolipoproteins B Human genes 0.000 description 9
- 108010027006 Apolipoproteins B Proteins 0.000 description 9
- 238000004458 analytical method Methods 0.000 description 9
- 239000003795 chemical substances by application Substances 0.000 description 9
- 239000000047 product Substances 0.000 description 9
- DTOSIQBPPRVQHS-UHFFFAOYSA-N α-Linolenic acid Chemical compound CCC=CCC=CCC=CCCCCCCCC(O)=O DTOSIQBPPRVQHS-UHFFFAOYSA-N 0.000 description 9
- GVJHHUAWPYXKBD-IEOSBIPESA-N (R)-alpha-Tocopherol Natural products OC1=C(C)C(C)=C2O[C@@](CCC[C@H](C)CCC[C@H](C)CCCC(C)C)(C)CCC2=C1C GVJHHUAWPYXKBD-IEOSBIPESA-N 0.000 description 8
- 235000021298 Dihomo-γ-linolenic acid Nutrition 0.000 description 8
- 229910052799 carbon Inorganic materials 0.000 description 8
- 230000003247 decreasing effect Effects 0.000 description 8
- HJUFTIJOISQSKQ-UHFFFAOYSA-N fenoxycarb Chemical compound C1=CC(OCCNC(=O)OCC)=CC=C1OC1=CC=CC=C1 HJUFTIJOISQSKQ-UHFFFAOYSA-N 0.000 description 8
- OQOCQFSPEWCSDO-UHFFFAOYSA-N heneicosapentaenoic acid Natural products CCC=CCC=CCC=CCC=CCC=CCCCCC(O)=O OQOCQFSPEWCSDO-UHFFFAOYSA-N 0.000 description 8
- 238000001727 in vivo Methods 0.000 description 8
- 229940012843 omega-3 fatty acid Drugs 0.000 description 8
- 108010010234 HDL Lipoproteins Proteins 0.000 description 7
- 230000002411 adverse Effects 0.000 description 7
- 230000004071 biological effect Effects 0.000 description 7
- 238000010586 diagram Methods 0.000 description 7
- 231100000673 dose–response relationship Toxicity 0.000 description 7
- 230000002526 effect on cardiovascular system Effects 0.000 description 7
- IQLUYYHUNSSHIY-HZUMYPAESA-N eicosatetraenoic acid Chemical compound CCCCCCCCCCC\C=C\C=C\C=C\C=C\C(O)=O IQLUYYHUNSSHIY-HZUMYPAESA-N 0.000 description 7
- 238000009472 formulation Methods 0.000 description 7
- 239000002471 hydroxymethylglutaryl coenzyme A reductase inhibitor Substances 0.000 description 7
- 235000021281 monounsaturated fatty acids Nutrition 0.000 description 7
- 239000003921 oil Substances 0.000 description 7
- 235000019198 oils Nutrition 0.000 description 7
- 239000006014 omega-3 oil Substances 0.000 description 7
- 235000003441 saturated fatty acids Nutrition 0.000 description 7
- 150000004671 saturated fatty acids Chemical class 0.000 description 7
- 241000251468 Actinopterygii Species 0.000 description 6
- 206010061218 Inflammation Diseases 0.000 description 6
- 102000004895 Lipoproteins Human genes 0.000 description 6
- 108090001030 Lipoproteins Proteins 0.000 description 6
- 238000010521 absorption reaction Methods 0.000 description 6
- 230000036765 blood level Effects 0.000 description 6
- 230000030833 cell death Effects 0.000 description 6
- 238000004821 distillation Methods 0.000 description 6
- 230000003828 downregulation Effects 0.000 description 6
- 238000002474 experimental method Methods 0.000 description 6
- 235000019688 fish Nutrition 0.000 description 6
- 235000009200 high fat diet Nutrition 0.000 description 6
- 230000004054 inflammatory process Effects 0.000 description 6
- 235000020667 long-chain omega-3 fatty acid Nutrition 0.000 description 6
- 102000004169 proteins and genes Human genes 0.000 description 6
- 230000011664 signaling Effects 0.000 description 6
- 108091003079 Bovine Serum Albumin Proteins 0.000 description 5
- 229920003163 Eudragit® NE 30 D Polymers 0.000 description 5
- 102000013691 Interleukin-17 Human genes 0.000 description 5
- 108050003558 Interleukin-17 Proteins 0.000 description 5
- 108010013563 Lipoprotein Lipase Proteins 0.000 description 5
- 102000043296 Lipoprotein lipases Human genes 0.000 description 5
- 241000700159 Rattus Species 0.000 description 5
- HQPCSDADVLFHHO-LTKCOYKYSA-N all-cis-8,11,14,17-icosatetraenoic acid Chemical compound CC\C=C/C\C=C/C\C=C/C\C=C/CCCCCCC(O)=O HQPCSDADVLFHHO-LTKCOYKYSA-N 0.000 description 5
- 238000000540 analysis of variance Methods 0.000 description 5
- 229940098773 bovine serum albumin Drugs 0.000 description 5
- 238000004422 calculation algorithm Methods 0.000 description 5
- 230000037198 cardiovascular physiology Effects 0.000 description 5
- 210000004027 cell Anatomy 0.000 description 5
- 230000007012 clinical effect Effects 0.000 description 5
- 229940013317 fish oils Drugs 0.000 description 5
- 235000013305 food Nutrition 0.000 description 5
- 230000006870 function Effects 0.000 description 5
- 230000004048 modification Effects 0.000 description 5
- 238000012986 modification Methods 0.000 description 5
- 239000006186 oral dosage form Substances 0.000 description 5
- 230000001124 posttranscriptional effect Effects 0.000 description 5
- 230000009885 systemic effect Effects 0.000 description 5
- 239000003826 tablet Substances 0.000 description 5
- 102100029077 3-hydroxy-3-methylglutaryl-coenzyme A reductase Human genes 0.000 description 4
- 108700028369 Alleles Proteins 0.000 description 4
- BSYNRYMUTXBXSQ-UHFFFAOYSA-N Aspirin Chemical compound CC(=O)OC1=CC=CC=C1C(O)=O BSYNRYMUTXBXSQ-UHFFFAOYSA-N 0.000 description 4
- 102000004190 Enzymes Human genes 0.000 description 4
- 108090000790 Enzymes Proteins 0.000 description 4
- 101001056878 Homo sapiens Squalene monooxygenase Proteins 0.000 description 4
- 102100025560 Squalene monooxygenase Human genes 0.000 description 4
- 229960001138 acetylsalicylic acid Drugs 0.000 description 4
- 239000003513 alkali Substances 0.000 description 4
- 229940087168 alpha tocopherol Drugs 0.000 description 4
- 235000020661 alpha-linolenic acid Nutrition 0.000 description 4
- 239000003963 antioxidant agent Substances 0.000 description 4
- 235000006708 antioxidants Nutrition 0.000 description 4
- 230000006696 biosynthetic metabolic pathway Effects 0.000 description 4
- 230000015572 biosynthetic process Effects 0.000 description 4
- 235000021152 breakfast Nutrition 0.000 description 4
- 230000000747 cardiac effect Effects 0.000 description 4
- 235000005911 diet Nutrition 0.000 description 4
- 229940088598 enzyme Drugs 0.000 description 4
- 238000010195 expression analysis Methods 0.000 description 4
- 210000003494 hepatocyte Anatomy 0.000 description 4
- 229960004488 linolenic acid Drugs 0.000 description 4
- 230000003278 mimic effect Effects 0.000 description 4
- 230000035755 proliferation Effects 0.000 description 4
- 238000010561 standard procedure Methods 0.000 description 4
- 239000000126 substance Substances 0.000 description 4
- 229960000984 tocofersolan Drugs 0.000 description 4
- 238000005809 transesterification reaction Methods 0.000 description 4
- 239000002076 α-tocopherol Substances 0.000 description 4
- 235000004835 α-tocopherol Nutrition 0.000 description 4
- DVSZKTAMJJTWFG-SKCDLICFSA-N (2e,4e,6e,8e,10e,12e)-docosa-2,4,6,8,10,12-hexaenoic acid Chemical compound CCCCCCCCC\C=C\C=C\C=C\C=C\C=C\C=C\C(O)=O DVSZKTAMJJTWFG-SKCDLICFSA-N 0.000 description 3
- 108010014720 2-methylacyl-CoA dehydrogenase Proteins 0.000 description 3
- GZJLLYHBALOKEX-UHFFFAOYSA-N 6-Ketone, O18-Me-Ussuriedine Natural products CC=CCC=CCC=CCC=CCC=CCC=CCCCC(O)=O GZJLLYHBALOKEX-UHFFFAOYSA-N 0.000 description 3
- 239000006144 Dulbecco’s modified Eagle's medium Substances 0.000 description 3
- 101000988577 Homo sapiens 3-hydroxy-3-methylglutaryl-coenzyme A reductase Proteins 0.000 description 3
- 101000929936 Homo sapiens Short/branched chain specific acyl-CoA dehydrogenase, mitochondrial Proteins 0.000 description 3
- 102100035766 Short/branched chain specific acyl-CoA dehydrogenase, mitochondrial Human genes 0.000 description 3
- HEMHJVSKTPXQMS-UHFFFAOYSA-M Sodium hydroxide Chemical compound [OH-].[Na+] HEMHJVSKTPXQMS-UHFFFAOYSA-M 0.000 description 3
- 230000003078 antioxidant effect Effects 0.000 description 3
- 230000008901 benefit Effects 0.000 description 3
- 238000004113 cell culture Methods 0.000 description 3
- 230000003915 cell function Effects 0.000 description 3
- 238000006243 chemical reaction Methods 0.000 description 3
- KRKNYBCHXYNGOX-UHFFFAOYSA-N citric acid Chemical compound OC(=O)CC(O)(C(O)=O)CC(O)=O KRKNYBCHXYNGOX-UHFFFAOYSA-N 0.000 description 3
- 208000029078 coronary artery disease Diseases 0.000 description 3
- 230000000875 corresponding effect Effects 0.000 description 3
- 230000037213 diet Effects 0.000 description 3
- KAUVQQXNCKESLC-UHFFFAOYSA-N docosahexaenoic acid (DHA) Natural products COC(=O)C(C)NOCC1=CC=CC=C1 KAUVQQXNCKESLC-UHFFFAOYSA-N 0.000 description 3
- 230000008406 drug-drug interaction Effects 0.000 description 3
- 238000011156 evaluation Methods 0.000 description 3
- 230000002349 favourable effect Effects 0.000 description 3
- 238000011223 gene expression profiling Methods 0.000 description 3
- 208000019622 heart disease Diseases 0.000 description 3
- 229960002600 icosapent ethyl Drugs 0.000 description 3
- 230000002757 inflammatory effect Effects 0.000 description 3
- 210000004185 liver Anatomy 0.000 description 3
- 150000004668 long chain fatty acids Chemical class 0.000 description 3
- 239000002609 medium Substances 0.000 description 3
- 230000037353 metabolic pathway Effects 0.000 description 3
- 230000037361 pathway Effects 0.000 description 3
- 238000000746 purification Methods 0.000 description 3
- 229920006395 saturated elastomer Polymers 0.000 description 3
- QDRKDTQENPPHOJ-UHFFFAOYSA-N sodium ethoxide Chemical compound [Na+].CC[O-] QDRKDTQENPPHOJ-UHFFFAOYSA-N 0.000 description 3
- 230000033772 system development Effects 0.000 description 3
- 230000003827 upregulation Effects 0.000 description 3
- VOXZDWNPVJITMN-ZBRFXRBCSA-N 17β-estradiol Chemical compound OC1=CC=C2[C@H]3CC[C@](C)([C@H](CC4)O)[C@@H]4[C@@H]3CCC2=C1 VOXZDWNPVJITMN-ZBRFXRBCSA-N 0.000 description 2
- 206010003211 Arteriosclerosis coronary artery Diseases 0.000 description 2
- IJGRMHOSHXDMSA-UHFFFAOYSA-N Atomic nitrogen Chemical compound N#N IJGRMHOSHXDMSA-UHFFFAOYSA-N 0.000 description 2
- 108010068197 Butyryl-CoA Dehydrogenase Proteins 0.000 description 2
- OKTJSMMVPCPJKN-UHFFFAOYSA-N Carbon Chemical compound [C] OKTJSMMVPCPJKN-UHFFFAOYSA-N 0.000 description 2
- 206010007572 Cardiac hypertrophy Diseases 0.000 description 2
- 208000006029 Cardiomegaly Diseases 0.000 description 2
- 206010008635 Cholestasis Diseases 0.000 description 2
- 206010012735 Diarrhoea Diseases 0.000 description 2
- 208000032928 Dyslipidaemia Diseases 0.000 description 2
- 102100034264 Guanine nucleotide-binding protein G(i) subunit alpha-3 Human genes 0.000 description 2
- 101000997034 Homo sapiens Guanine nucleotide-binding protein G(i) subunit alpha-3 Proteins 0.000 description 2
- 108090000895 Hydroxymethylglutaryl CoA Reductases Proteins 0.000 description 2
- 101150014691 PPARA gene Proteins 0.000 description 2
- 238000002123 RNA extraction Methods 0.000 description 2
- 239000013614 RNA sample Substances 0.000 description 2
- 206010038481 Renal necrosis Diseases 0.000 description 2
- 241000269821 Scombridae Species 0.000 description 2
- 229920002472 Starch Polymers 0.000 description 2
- 229930182558 Sterol Natural products 0.000 description 2
- 206010003246 arthritis Diseases 0.000 description 2
- 230000033228 biological regulation Effects 0.000 description 2
- 238000004061 bleaching Methods 0.000 description 2
- 235000019282 butylated hydroxyanisole Nutrition 0.000 description 2
- 238000011072 cell harvest Methods 0.000 description 2
- 235000013351 cheese Nutrition 0.000 description 2
- 208000026758 coronary atherosclerosis Diseases 0.000 description 2
- 230000002596 correlated effect Effects 0.000 description 2
- DDRJAANPRJIHGJ-UHFFFAOYSA-N creatinine Chemical compound CN1CC(=O)NC1=N DDRJAANPRJIHGJ-UHFFFAOYSA-N 0.000 description 2
- 238000001514 detection method Methods 0.000 description 2
- 229910003460 diamond Inorganic materials 0.000 description 2
- 239000010432 diamond Substances 0.000 description 2
- 230000009699 differential effect Effects 0.000 description 2
- 208000037265 diseases, disorders, signs and symptoms Diseases 0.000 description 2
- 238000009826 distribution Methods 0.000 description 2
- 150000002148 esters Chemical class 0.000 description 2
- 238000010932 ethanolysis reaction Methods 0.000 description 2
- 235000020937 fasting conditions Nutrition 0.000 description 2
- 235000013861 fat-free Nutrition 0.000 description 2
- 230000009246 food effect Effects 0.000 description 2
- 235000021471 food effect Nutrition 0.000 description 2
- 230000002440 hepatic effect Effects 0.000 description 2
- 206010019692 hepatic necrosis Diseases 0.000 description 2
- 208000006454 hepatitis Diseases 0.000 description 2
- 230000005764 inhibitory process Effects 0.000 description 2
- 239000007788 liquid Substances 0.000 description 2
- 231100000149 liver necrosis Toxicity 0.000 description 2
- 235000010598 long-chain omega-6 fatty acid Nutrition 0.000 description 2
- 235000020978 long-chain polyunsaturated fatty acids Nutrition 0.000 description 2
- 230000007774 longterm Effects 0.000 description 2
- 210000004072 lung Anatomy 0.000 description 2
- 238000005259 measurement Methods 0.000 description 2
- 230000004879 molecular function Effects 0.000 description 2
- 208000008338 non-alcoholic fatty liver disease Diseases 0.000 description 2
- 206010053219 non-alcoholic steatohepatitis Diseases 0.000 description 2
- 229940033080 omega-6 fatty acid Drugs 0.000 description 2
- 230000000144 pharmacologic effect Effects 0.000 description 2
- 238000002360 preparation method Methods 0.000 description 2
- 238000012545 processing Methods 0.000 description 2
- LXNHXLLTXMVWPM-UHFFFAOYSA-N pyridoxine Chemical compound CC1=NC=C(CO)C(CO)=C1O LXNHXLLTXMVWPM-UHFFFAOYSA-N 0.000 description 2
- 238000012429 release testing Methods 0.000 description 2
- 239000000523 sample Substances 0.000 description 2
- 235000019698 starch Nutrition 0.000 description 2
- 239000008107 starch Substances 0.000 description 2
- 150000003432 sterols Chemical class 0.000 description 2
- 235000003702 sterols Nutrition 0.000 description 2
- UCSJYZPVAKXKNQ-HZYVHMACSA-N streptomycin Chemical compound CN[C@H]1[C@H](O)[C@@H](O)[C@H](CO)O[C@H]1O[C@@H]1[C@](C=O)(O)[C@H](C)O[C@H]1O[C@@H]1[C@@H](NC(N)=N)[C@H](O)[C@@H](NC(N)=N)[C@H](O)[C@H]1O UCSJYZPVAKXKNQ-HZYVHMACSA-N 0.000 description 2
- 238000003786 synthesis reaction Methods 0.000 description 2
- 238000012360 testing method Methods 0.000 description 2
- 230000001225 therapeutic effect Effects 0.000 description 2
- 231100000048 toxicity data Toxicity 0.000 description 2
- 231100000027 toxicology Toxicity 0.000 description 2
- 150000003672 ureas Chemical class 0.000 description 2
- MJYQFWSXKFLTAY-OVEQLNGDSA-N (2r,3r)-2,3-bis[(4-hydroxy-3-methoxyphenyl)methyl]butane-1,4-diol;(2r,3r,4s,5s,6r)-6-(hydroxymethyl)oxane-2,3,4,5-tetrol Chemical compound OC[C@H]1O[C@@H](O)[C@H](O)[C@@H](O)[C@@H]1O.C1=C(O)C(OC)=CC(C[C@@H](CO)[C@H](CO)CC=2C=C(OC)C(O)=CC=2)=C1 MJYQFWSXKFLTAY-OVEQLNGDSA-N 0.000 description 1
- AVKOENOBFIYBSA-WMPRHZDHSA-N (4Z,7Z,10Z,13Z,16Z)-docosa-4,7,10,13,16-pentaenoic acid Chemical compound CCCCC\C=C/C\C=C/C\C=C/C\C=C/C\C=C/CCC(O)=O AVKOENOBFIYBSA-WMPRHZDHSA-N 0.000 description 1
- 101150065145 ACADSB gene Proteins 0.000 description 1
- 240000005020 Acaciella glauca Species 0.000 description 1
- 229920001817 Agar Polymers 0.000 description 1
- 101710150365 Albumin-1 Proteins 0.000 description 1
- 240000002900 Arthrospira platensis Species 0.000 description 1
- 235000016425 Arthrospira platensis Nutrition 0.000 description 1
- 201000001320 Atherosclerosis Diseases 0.000 description 1
- 238000012935 Averaging Methods 0.000 description 1
- 239000005552 B01AC04 - Clopidogrel Substances 0.000 description 1
- 241000283690 Bos taurus Species 0.000 description 1
- 241000273930 Brevoortia tyrannus Species 0.000 description 1
- 239000004255 Butylated hydroxyanisole Substances 0.000 description 1
- 102100027207 CD27 antigen Human genes 0.000 description 1
- 244000025254 Cannabis sativa Species 0.000 description 1
- 235000012766 Cannabis sativa ssp. sativa var. sativa Nutrition 0.000 description 1
- 235000012765 Cannabis sativa ssp. sativa var. spontanea Nutrition 0.000 description 1
- 206010048610 Cardiotoxicity Diseases 0.000 description 1
- 208000024172 Cardiovascular disease Diseases 0.000 description 1
- 108010004103 Chylomicrons Proteins 0.000 description 1
- 241000555825 Clupeidae Species 0.000 description 1
- 241001454694 Clupeiformes Species 0.000 description 1
- 102000008186 Collagen Human genes 0.000 description 1
- 108010035532 Collagen Proteins 0.000 description 1
- 208000035473 Communicable disease Diseases 0.000 description 1
- 206010010356 Congenital anomaly Diseases 0.000 description 1
- 101100202237 Danio rerio rxrab gene Proteins 0.000 description 1
- 101100309320 Danio rerio rxrga gene Proteins 0.000 description 1
- 208000012239 Developmental disease Diseases 0.000 description 1
- 206010014486 Elevated triglycerides Diseases 0.000 description 1
- 241000167554 Engraulidae Species 0.000 description 1
- 101150042207 FADS1 gene Proteins 0.000 description 1
- 101150097000 FADS2 gene Proteins 0.000 description 1
- OPGOLNDOMSBSCW-CLNHMMGSSA-N Fursultiamine hydrochloride Chemical compound Cl.C1CCOC1CSSC(\CCO)=C(/C)N(C=O)CC1=CN=C(C)N=C1N OPGOLNDOMSBSCW-CLNHMMGSSA-N 0.000 description 1
- 102100040861 G0/G1 switch protein 2 Human genes 0.000 description 1
- 241000206672 Gelidium Species 0.000 description 1
- 206010018364 Glomerulonephritis Diseases 0.000 description 1
- WQZGKKKJIJFFOK-GASJEMHNSA-N Glucose Natural products OC[C@H]1OC(O)[C@H](O)[C@@H](O)[C@@H]1O WQZGKKKJIJFFOK-GASJEMHNSA-N 0.000 description 1
- 229920002907 Guar gum Polymers 0.000 description 1
- 101150053603 HMGCR gene Proteins 0.000 description 1
- 206010019233 Headaches Diseases 0.000 description 1
- 102100032813 Hepatocyte growth factor-like protein Human genes 0.000 description 1
- 206010019842 Hepatomegaly Diseases 0.000 description 1
- 206010019851 Hepatotoxicity Diseases 0.000 description 1
- 101000914511 Homo sapiens CD27 antigen Proteins 0.000 description 1
- 101000893656 Homo sapiens G0/G1 switch protein 2 Proteins 0.000 description 1
- 101001066435 Homo sapiens Hepatocyte growth factor-like protein Proteins 0.000 description 1
- 101001035137 Homo sapiens Homocysteine-responsive endoplasmic reticulum-resident ubiquitin-like domain member 1 protein Proteins 0.000 description 1
- 101000961071 Homo sapiens NF-kappa-B inhibitor alpha Proteins 0.000 description 1
- 101000979342 Homo sapiens Nuclear factor NF-kappa-B p105 subunit Proteins 0.000 description 1
- 101000797990 Homo sapiens Putative activator of 90 kDa heat shock protein ATPase homolog 2 Proteins 0.000 description 1
- 101000999079 Homo sapiens Radiation-inducible immediate-early gene IEX-1 Proteins 0.000 description 1
- 101000947881 Homo sapiens S-adenosylmethionine synthase isoform type-2 Proteins 0.000 description 1
- 101000880431 Homo sapiens Serine/threonine-protein kinase 4 Proteins 0.000 description 1
- 101000795107 Homo sapiens Triggering receptor expressed on myeloid cells 1 Proteins 0.000 description 1
- 101000830603 Homo sapiens Tumor necrosis factor ligand superfamily member 11 Proteins 0.000 description 1
- 101000785613 Homo sapiens Zinc finger protein 652 Proteins 0.000 description 1
- 101000743781 Homo sapiens Zinc finger protein 91 Proteins 0.000 description 1
- 102100039923 Homocysteine-responsive endoplasmic reticulum-resident ubiquitin-like domain member 1 protein Human genes 0.000 description 1
- 206010020524 Hydronephrosis Diseases 0.000 description 1
- 208000031226 Hyperlipidaemia Diseases 0.000 description 1
- 201000010252 Hyperlipoproteinemia Type III Diseases 0.000 description 1
- 238000012404 In vitro experiment Methods 0.000 description 1
- 108090001007 Interleukin-8 Proteins 0.000 description 1
- 229920002752 Konjac Polymers 0.000 description 1
- 206010067125 Liver injury Diseases 0.000 description 1
- 240000003183 Manihot esculenta Species 0.000 description 1
- 235000016735 Manihot esculenta subsp esculenta Nutrition 0.000 description 1
- 208000001145 Metabolic Syndrome Diseases 0.000 description 1
- 241001465754 Metazoa Species 0.000 description 1
- 102100039337 NF-kappa-B inhibitor alpha Human genes 0.000 description 1
- 206010028980 Neoplasm Diseases 0.000 description 1
- 206010029155 Nephropathy toxic Diseases 0.000 description 1
- 102100023050 Nuclear factor NF-kappa-B p105 subunit Human genes 0.000 description 1
- 235000006538 Opuntia tuna Nutrition 0.000 description 1
- 244000237189 Opuntia tuna Species 0.000 description 1
- 102000019280 Pancreatic lipases Human genes 0.000 description 1
- 108050006759 Pancreatic lipases Proteins 0.000 description 1
- 229930182555 Penicillin Natural products 0.000 description 1
- JGSARLDLIJGVTE-MBNYWOFBSA-N Penicillin G Chemical compound N([C@H]1[C@H]2SC([C@@H](N2C1=O)C(O)=O)(C)C)C(=O)CC1=CC=CC=C1 JGSARLDLIJGVTE-MBNYWOFBSA-N 0.000 description 1
- 235000004347 Perilla Nutrition 0.000 description 1
- 244000124853 Perilla frutescens Species 0.000 description 1
- 201000004681 Psoriasis Diseases 0.000 description 1
- 102100032319 Putative activator of 90 kDa heat shock protein ATPase homolog 2 Human genes 0.000 description 1
- 101150050070 RXRA gene Proteins 0.000 description 1
- 102100036900 Radiation-inducible immediate-early gene IEX-1 Human genes 0.000 description 1
- 241000700157 Rattus norvegicus Species 0.000 description 1
- 102100021258 Regulator of G-protein signaling 2 Human genes 0.000 description 1
- 101710140412 Regulator of G-protein signaling 2 Proteins 0.000 description 1
- 240000001890 Ribes hudsonianum Species 0.000 description 1
- 235000016954 Ribes hudsonianum Nutrition 0.000 description 1
- 235000001466 Ribes nigrum Nutrition 0.000 description 1
- 102100035947 S-adenosylmethionine synthase isoform type-2 Human genes 0.000 description 1
- 101000650578 Salmonella phage P22 Regulatory protein C3 Proteins 0.000 description 1
- 241001125046 Sardina pilchardus Species 0.000 description 1
- 102000005782 Squalene Monooxygenase Human genes 0.000 description 1
- 108020003891 Squalene monooxygenase Proteins 0.000 description 1
- 241000282887 Suidae Species 0.000 description 1
- HXWJFEZDFPRLBG-UHFFFAOYSA-N Timnodonic acid Natural products CCCC=CC=CCC=CCC=CCC=CCCCC(O)=O HXWJFEZDFPRLBG-UHFFFAOYSA-N 0.000 description 1
- 102100029681 Triggering receptor expressed on myeloid cells 1 Human genes 0.000 description 1
- 101001040920 Triticum aestivum Alpha-amylase inhibitor 0.28 Proteins 0.000 description 1
- 102100024568 Tumor necrosis factor ligand superfamily member 11 Human genes 0.000 description 1
- 206010060751 Type III hyperlipidaemia Diseases 0.000 description 1
- 208000012931 Urologic disease Diseases 0.000 description 1
- 240000008042 Zea mays Species 0.000 description 1
- 235000005824 Zea mays ssp. parviglumis Nutrition 0.000 description 1
- 235000002017 Zea mays subsp mays Nutrition 0.000 description 1
- 102100026453 Zinc finger protein 652 Human genes 0.000 description 1
- 102100039070 Zinc finger protein 91 Human genes 0.000 description 1
- 201000000690 abdominal obesity-metabolic syndrome Diseases 0.000 description 1
- 238000009825 accumulation Methods 0.000 description 1
- 150000007513 acids Chemical class 0.000 description 1
- 230000009471 action Effects 0.000 description 1
- 230000004913 activation Effects 0.000 description 1
- 239000008186 active pharmaceutical agent Substances 0.000 description 1
- 230000006978 adaptation Effects 0.000 description 1
- 239000000654 additive Substances 0.000 description 1
- 230000000996 additive effect Effects 0.000 description 1
- 235000010419 agar Nutrition 0.000 description 1
- 210000005058 airway cell Anatomy 0.000 description 1
- 230000000172 allergic effect Effects 0.000 description 1
- 150000001413 amino acids Chemical class 0.000 description 1
- 238000012197 amplification kit Methods 0.000 description 1
- 235000019513 anchovy Nutrition 0.000 description 1
- 239000008346 aqueous phase Substances 0.000 description 1
- 238000003491 array Methods 0.000 description 1
- 206010003119 arrhythmia Diseases 0.000 description 1
- 238000003556 assay Methods 0.000 description 1
- 208000010668 atopic eczema Diseases 0.000 description 1
- 239000011324 bead Substances 0.000 description 1
- 229920000080 bile acid sequestrant Polymers 0.000 description 1
- 229940096699 bile acid sequestrants Drugs 0.000 description 1
- 239000000090 biomarker Substances 0.000 description 1
- 230000000740 bleeding effect Effects 0.000 description 1
- 238000010241 blood sampling Methods 0.000 description 1
- CZBZUDVBLSSABA-UHFFFAOYSA-N butylated hydroxyanisole Chemical compound COC1=CC=C(O)C(C(C)(C)C)=C1.COC1=CC=C(O)C=C1C(C)(C)C CZBZUDVBLSSABA-UHFFFAOYSA-N 0.000 description 1
- 229940043253 butylated hydroxyanisole Drugs 0.000 description 1
- 239000006227 byproduct Substances 0.000 description 1
- 238000004364 calculation method Methods 0.000 description 1
- 235000009120 camo Nutrition 0.000 description 1
- 230000000711 cancerogenic effect Effects 0.000 description 1
- 230000008777 canonical pathway Effects 0.000 description 1
- 231100000357 carcinogen Toxicity 0.000 description 1
- 239000003183 carcinogenic agent Substances 0.000 description 1
- 230000003683 cardiac damage Effects 0.000 description 1
- 230000009787 cardiac fibrosis Effects 0.000 description 1
- 231100000259 cardiotoxicity Toxicity 0.000 description 1
- 239000000679 carrageenan Substances 0.000 description 1
- 235000010418 carrageenan Nutrition 0.000 description 1
- 229920001525 carrageenan Polymers 0.000 description 1
- 229940113118 carrageenan Drugs 0.000 description 1
- 230000015556 catabolic process Effects 0.000 description 1
- 230000020411 cell activation Effects 0.000 description 1
- 230000010261 cell growth Effects 0.000 description 1
- 230000009087 cell motility Effects 0.000 description 1
- 230000004663 cell proliferation Effects 0.000 description 1
- 230000023715 cellular developmental process Effects 0.000 description 1
- 230000001413 cellular effect Effects 0.000 description 1
- 235000005607 chanvre indien Nutrition 0.000 description 1
- 231100000359 cholestasis Toxicity 0.000 description 1
- 230000007870 cholestasis Effects 0.000 description 1
- 230000001906 cholesterol absorption Effects 0.000 description 1
- 238000011097 chromatography purification Methods 0.000 description 1
- GKTWGGQPFAXNFI-HNNXBMFYSA-N clopidogrel Chemical compound C1([C@H](N2CC=3C=CSC=3CC2)C(=O)OC)=CC=CC=C1Cl GKTWGGQPFAXNFI-HNNXBMFYSA-N 0.000 description 1
- 238000011260 co-administration Methods 0.000 description 1
- 229920001436 collagen Polymers 0.000 description 1
- 230000009918 complex formation Effects 0.000 description 1
- 150000001875 compounds Chemical class 0.000 description 1
- 230000033035 connective tissue development Effects 0.000 description 1
- 208000018631 connective tissue disease Diseases 0.000 description 1
- 239000000356 contaminant Substances 0.000 description 1
- 235000005822 corn Nutrition 0.000 description 1
- 229940109239 creatinine Drugs 0.000 description 1
- 230000001955 cumulated effect Effects 0.000 description 1
- 230000006378 damage Effects 0.000 description 1
- 238000007405 data analysis Methods 0.000 description 1
- 230000007812 deficiency Effects 0.000 description 1
- 230000006735 deficit Effects 0.000 description 1
- CYQFCXCEBYINGO-IAGOWNOFSA-N delta1-THC Chemical compound C1=C(C)CC[C@H]2C(C)(C)OC3=CC(CCCCC)=CC(O)=C3[C@@H]21 CYQFCXCEBYINGO-IAGOWNOFSA-N 0.000 description 1
- 238000011161 development Methods 0.000 description 1
- 230000018109 developmental process Effects 0.000 description 1
- 235000020931 dietary conditions Nutrition 0.000 description 1
- 230000000378 dietary effect Effects 0.000 description 1
- 235000018823 dietary intake Nutrition 0.000 description 1
- 235000015872 dietary supplement Nutrition 0.000 description 1
- 201000010099 disease Diseases 0.000 description 1
- 208000035475 disorder Diseases 0.000 description 1
- 238000004090 dissolution Methods 0.000 description 1
- 230000004064 dysfunction Effects 0.000 description 1
- 235000013399 edible fruits Nutrition 0.000 description 1
- 230000002124 endocrine Effects 0.000 description 1
- 210000002889 endothelial cell Anatomy 0.000 description 1
- 239000002158 endotoxin Substances 0.000 description 1
- 239000002662 enteric coated tablet Substances 0.000 description 1
- 230000007613 environmental effect Effects 0.000 description 1
- 239000003344 environmental pollutant Substances 0.000 description 1
- 230000002255 enzymatic effect Effects 0.000 description 1
- 210000003743 erythrocyte Anatomy 0.000 description 1
- 235000004626 essential fatty acids Nutrition 0.000 description 1
- 229960005309 estradiol Drugs 0.000 description 1
- 238000000605 extraction Methods 0.000 description 1
- 229940125753 fibrate Drugs 0.000 description 1
- 210000002950 fibroblast Anatomy 0.000 description 1
- 239000012467 final product Substances 0.000 description 1
- 235000004426 flaxseed Nutrition 0.000 description 1
- 238000012632 fluorescent imaging Methods 0.000 description 1
- 235000014106 fortified food Nutrition 0.000 description 1
- 238000004508 fractional distillation Methods 0.000 description 1
- 238000005194 fractionation Methods 0.000 description 1
- 230000007849 functional defect Effects 0.000 description 1
- 239000007789 gas Substances 0.000 description 1
- 238000004817 gas chromatography Methods 0.000 description 1
- 230000002496 gastric effect Effects 0.000 description 1
- 238000003205 genotyping method Methods 0.000 description 1
- 239000008103 glucose Substances 0.000 description 1
- ZDXPYRJPNDTMRX-UHFFFAOYSA-N glutamine Natural products OC(=O)C(N)CCC(N)=O ZDXPYRJPNDTMRX-UHFFFAOYSA-N 0.000 description 1
- 239000000665 guar gum Substances 0.000 description 1
- 235000010417 guar gum Nutrition 0.000 description 1
- 229960002154 guar gum Drugs 0.000 description 1
- 231100000869 headache Toxicity 0.000 description 1
- 238000005534 hematocrit Methods 0.000 description 1
- 208000014951 hematologic disease Diseases 0.000 description 1
- 230000008191 hematological system development Effects 0.000 description 1
- 208000018706 hematopoietic system disease Diseases 0.000 description 1
- 230000011132 hemopoiesis Effects 0.000 description 1
- 239000011487 hemp Substances 0.000 description 1
- 231100000234 hepatic damage Toxicity 0.000 description 1
- 210000004024 hepatic stellate cell Anatomy 0.000 description 1
- 231100000283 hepatitis Toxicity 0.000 description 1
- 231100000304 hepatotoxicity Toxicity 0.000 description 1
- 230000007686 hepatotoxicity Effects 0.000 description 1
- 238000009396 hybridization Methods 0.000 description 1
- 230000007062 hydrolysis Effects 0.000 description 1
- 238000006460 hydrolysis reaction Methods 0.000 description 1
- 208000020346 hyperlipoproteinemia Diseases 0.000 description 1
- 208000020887 hyperlipoproteinemia type 3 Diseases 0.000 description 1
- 206010020718 hyperplasia Diseases 0.000 description 1
- 210000002865 immune cell Anatomy 0.000 description 1
- 208000026278 immune system disease Diseases 0.000 description 1
- 238000011534 incubation Methods 0.000 description 1
- 239000011261 inert gas Substances 0.000 description 1
- 208000015181 infectious disease Diseases 0.000 description 1
- 208000027866 inflammatory disease Diseases 0.000 description 1
- 239000003112 inhibitor Substances 0.000 description 1
- 230000003993 interaction Effects 0.000 description 1
- 208000017169 kidney disease Diseases 0.000 description 1
- 235000010485 konjac Nutrition 0.000 description 1
- 238000012417 linear regression Methods 0.000 description 1
- KQQKGWQCNNTQJW-UHFFFAOYSA-N linolenic acid Natural products CC=CCCC=CCC=CCCCCCCCC(O)=O KQQKGWQCNNTQJW-UHFFFAOYSA-N 0.000 description 1
- 235000019626 lipase activity Nutrition 0.000 description 1
- 229920006008 lipopolysaccharide Polymers 0.000 description 1
- 230000008818 liver damage Effects 0.000 description 1
- 208000018191 liver inflammation Diseases 0.000 description 1
- 210000004698 lymphocyte Anatomy 0.000 description 1
- 210000003563 lymphoid tissue Anatomy 0.000 description 1
- 235000020640 mackerel Nutrition 0.000 description 1
- 210000002540 macrophage Anatomy 0.000 description 1
- 238000012423 maintenance Methods 0.000 description 1
- 239000000463 material Substances 0.000 description 1
- 231100000682 maximum tolerated dose Toxicity 0.000 description 1
- 230000007246 mechanism Effects 0.000 description 1
- 239000012528 membrane Substances 0.000 description 1
- 238000010197 meta-analysis Methods 0.000 description 1
- 230000002503 metabolic effect Effects 0.000 description 1
- 150000004702 methyl esters Chemical class 0.000 description 1
- 210000003470 mitochondria Anatomy 0.000 description 1
- 230000002438 mitochondrial effect Effects 0.000 description 1
- 230000003387 muscular Effects 0.000 description 1
- 235000021288 n-6 DPA Nutrition 0.000 description 1
- 230000017074 necrotic cell death Effects 0.000 description 1
- 201000008383 nephritis Diseases 0.000 description 1
- 230000007694 nephrotoxicity Effects 0.000 description 1
- 231100000417 nephrotoxicity Toxicity 0.000 description 1
- 210000000440 neutrophil Anatomy 0.000 description 1
- 239000002547 new drug Substances 0.000 description 1
- 229910052757 nitrogen Inorganic materials 0.000 description 1
- 229910052756 noble gas Inorganic materials 0.000 description 1
- 239000002417 nutraceutical Substances 0.000 description 1
- 235000021436 nutraceutical agent Nutrition 0.000 description 1
- 230000035764 nutrition Effects 0.000 description 1
- 235000016709 nutrition Nutrition 0.000 description 1
- 238000005457 optimization Methods 0.000 description 1
- 238000006213 oxygenation reaction Methods 0.000 description 1
- 229940116369 pancreatic lipase Drugs 0.000 description 1
- 235000010987 pectin Nutrition 0.000 description 1
- 229920001277 pectin Polymers 0.000 description 1
- 239000001814 pectin Substances 0.000 description 1
- 229940049954 penicillin Drugs 0.000 description 1
- 239000003614 peroxisome proliferator Substances 0.000 description 1
- 238000010587 phase diagram Methods 0.000 description 1
- 230000001766 physiological effect Effects 0.000 description 1
- 235000013550 pizza Nutrition 0.000 description 1
- 229940020573 plavix Drugs 0.000 description 1
- 230000004983 pleiotropic effect Effects 0.000 description 1
- 235000013606 potato chips Nutrition 0.000 description 1
- 229920001592 potato starch Polymers 0.000 description 1
- 230000003389 potentiating effect Effects 0.000 description 1
- 235000008160 pyridoxine Nutrition 0.000 description 1
- 239000011677 pyridoxine Substances 0.000 description 1
- 238000009790 rate-determining step (RDS) Methods 0.000 description 1
- 230000035484 reaction time Effects 0.000 description 1
- 235000003499 redwood Nutrition 0.000 description 1
- 210000004994 reproductive system Anatomy 0.000 description 1
- 208000017443 reproductive system disease Diseases 0.000 description 1
- 208000023504 respiratory system disease Diseases 0.000 description 1
- 238000010839 reverse transcription Methods 0.000 description 1
- 238000012552 review Methods 0.000 description 1
- 235000019512 sardine Nutrition 0.000 description 1
- 238000012216 screening Methods 0.000 description 1
- 238000000926 separation method Methods 0.000 description 1
- 230000007781 signaling event Effects 0.000 description 1
- XWLXKKNPFMNSFA-HGQWONQESA-N simvastatin hydroxy acid Chemical compound C1=C[C@H](C)[C@H](CC[C@@H](O)C[C@@H](O)CC(O)=O)[C@H]2[C@@H](OC(=O)C(C)(C)CC)C[C@@H](C)C=C21 XWLXKKNPFMNSFA-HGQWONQESA-N 0.000 description 1
- 210000000813 small intestine Anatomy 0.000 description 1
- 229910000030 sodium bicarbonate Inorganic materials 0.000 description 1
- 239000007787 solid Substances 0.000 description 1
- 239000002904 solvent Substances 0.000 description 1
- 229940082787 spirulina Drugs 0.000 description 1
- 208000010110 spontaneous platelet aggregation Diseases 0.000 description 1
- 238000012453 sprague-dawley rat model Methods 0.000 description 1
- 238000007619 statistical method Methods 0.000 description 1
- 210000002784 stomach Anatomy 0.000 description 1
- 229960005322 streptomycin Drugs 0.000 description 1
- 108010013480 succinylated gelatin Proteins 0.000 description 1
- 229940007079 succinylated gelatin Drugs 0.000 description 1
- 238000000194 supercritical-fluid extraction Methods 0.000 description 1
- 239000013589 supplement Substances 0.000 description 1
- 230000004083 survival effect Effects 0.000 description 1
- 230000002123 temporal effect Effects 0.000 description 1
- 229950009260 tenivastatin Drugs 0.000 description 1
- 230000036962 time dependent Effects 0.000 description 1
- 210000001519 tissue Anatomy 0.000 description 1
- 230000025366 tissue development Effects 0.000 description 1
- 230000032258 transport Effects 0.000 description 1
- 125000005457 triglyceride group Chemical group 0.000 description 1
- 208000001072 type 2 diabetes mellitus Diseases 0.000 description 1
- 235000021122 unsaturated fatty acids Nutrition 0.000 description 1
- 150000004670 unsaturated fatty acids Chemical class 0.000 description 1
- 208000014001 urinary system disease Diseases 0.000 description 1
- 229940011671 vitamin b6 Drugs 0.000 description 1
- 238000005406 washing Methods 0.000 description 1
- 230000003442 weekly effect Effects 0.000 description 1
- 235000013618 yogurt Nutrition 0.000 description 1
- UHVMMEOXYDMDKI-JKYCWFKZSA-L zinc;1-(5-cyanopyridin-2-yl)-3-[(1s,2s)-2-(6-fluoro-2-hydroxy-3-propanoylphenyl)cyclopropyl]urea;diacetate Chemical compound [Zn+2].CC([O-])=O.CC([O-])=O.CCC(=O)C1=CC=C(F)C([C@H]2[C@H](C2)NC(=O)NC=2N=CC(=CC=2)C#N)=C1O UHVMMEOXYDMDKI-JKYCWFKZSA-L 0.000 description 1
- 229940072168 zocor Drugs 0.000 description 1
- 125000001020 α-tocopherol group Chemical group 0.000 description 1
Classifications
-
- A—HUMAN NECESSITIES
- A61—MEDICAL OR VETERINARY SCIENCE; HYGIENE
- A61K—PREPARATIONS FOR MEDICAL, DENTAL OR TOILETRY PURPOSES
- A61K31/00—Medicinal preparations containing organic active ingredients
- A61K31/185—Acids; Anhydrides, halides or salts thereof, e.g. sulfur acids, imidic, hydrazonic or hydroximic acids
- A61K31/19—Carboxylic acids, e.g. valproic acid
- A61K31/20—Carboxylic acids, e.g. valproic acid having a carboxyl group bound to a chain of seven or more carbon atoms, e.g. stearic, palmitic, arachidic acids
- A61K31/202—Carboxylic acids, e.g. valproic acid having a carboxyl group bound to a chain of seven or more carbon atoms, e.g. stearic, palmitic, arachidic acids having three or more double bonds, e.g. linolenic
-
- A—HUMAN NECESSITIES
- A61—MEDICAL OR VETERINARY SCIENCE; HYGIENE
- A61K—PREPARATIONS FOR MEDICAL, DENTAL OR TOILETRY PURPOSES
- A61K45/00—Medicinal preparations containing active ingredients not provided for in groups A61K31/00 - A61K41/00
- A61K45/06—Mixtures of active ingredients without chemical characterisation, e.g. antiphlogistics and cardiaca
-
- A—HUMAN NECESSITIES
- A61—MEDICAL OR VETERINARY SCIENCE; HYGIENE
- A61K—PREPARATIONS FOR MEDICAL, DENTAL OR TOILETRY PURPOSES
- A61K31/00—Medicinal preparations containing organic active ingredients
- A61K31/185—Acids; Anhydrides, halides or salts thereof, e.g. sulfur acids, imidic, hydrazonic or hydroximic acids
- A61K31/19—Carboxylic acids, e.g. valproic acid
- A61K31/20—Carboxylic acids, e.g. valproic acid having a carboxyl group bound to a chain of seven or more carbon atoms, e.g. stearic, palmitic, arachidic acids
- A61K31/201—Carboxylic acids, e.g. valproic acid having a carboxyl group bound to a chain of seven or more carbon atoms, e.g. stearic, palmitic, arachidic acids having one or two double bonds, e.g. oleic, linoleic acids
-
- A—HUMAN NECESSITIES
- A61—MEDICAL OR VETERINARY SCIENCE; HYGIENE
- A61K—PREPARATIONS FOR MEDICAL, DENTAL OR TOILETRY PURPOSES
- A61K31/00—Medicinal preparations containing organic active ingredients
- A61K31/21—Esters, e.g. nitroglycerine, selenocyanates
- A61K31/215—Esters, e.g. nitroglycerine, selenocyanates of carboxylic acids
- A61K31/22—Esters, e.g. nitroglycerine, selenocyanates of carboxylic acids of acyclic acids, e.g. pravastatin
-
- A—HUMAN NECESSITIES
- A61—MEDICAL OR VETERINARY SCIENCE; HYGIENE
- A61K—PREPARATIONS FOR MEDICAL, DENTAL OR TOILETRY PURPOSES
- A61K31/00—Medicinal preparations containing organic active ingredients
- A61K31/21—Esters, e.g. nitroglycerine, selenocyanates
- A61K31/27—Esters, e.g. nitroglycerine, selenocyanates of carbamic or thiocarbamic acids, meprobamate, carbachol, neostigmine
-
- A—HUMAN NECESSITIES
- A61—MEDICAL OR VETERINARY SCIENCE; HYGIENE
- A61K—PREPARATIONS FOR MEDICAL, DENTAL OR TOILETRY PURPOSES
- A61K31/00—Medicinal preparations containing organic active ingredients
- A61K31/33—Heterocyclic compounds
- A61K31/335—Heterocyclic compounds having oxygen as the only ring hetero atom, e.g. fungichromin
- A61K31/365—Lactones
- A61K31/366—Lactones having six-membered rings, e.g. delta-lactones
-
- A—HUMAN NECESSITIES
- A61—MEDICAL OR VETERINARY SCIENCE; HYGIENE
- A61K—PREPARATIONS FOR MEDICAL, DENTAL OR TOILETRY PURPOSES
- A61K47/00—Medicinal preparations characterised by the non-active ingredients used, e.g. carriers or inert additives; Targeting or modifying agents chemically bound to the active ingredient
- A61K47/30—Macromolecular organic or inorganic compounds, e.g. inorganic polyphosphates
- A61K47/32—Macromolecular compounds obtained by reactions only involving carbon-to-carbon unsaturated bonds, e.g. carbomers, poly(meth)acrylates, or polyvinyl pyrrolidone
-
- A—HUMAN NECESSITIES
- A61—MEDICAL OR VETERINARY SCIENCE; HYGIENE
- A61K—PREPARATIONS FOR MEDICAL, DENTAL OR TOILETRY PURPOSES
- A61K9/00—Medicinal preparations characterised by special physical form
- A61K9/48—Preparations in capsules, e.g. of gelatin, of chocolate
-
- A—HUMAN NECESSITIES
- A61—MEDICAL OR VETERINARY SCIENCE; HYGIENE
- A61K—PREPARATIONS FOR MEDICAL, DENTAL OR TOILETRY PURPOSES
- A61K9/00—Medicinal preparations characterised by special physical form
- A61K9/48—Preparations in capsules, e.g. of gelatin, of chocolate
- A61K9/4816—Wall or shell material
- A61K9/4825—Proteins, e.g. gelatin
-
- A—HUMAN NECESSITIES
- A61—MEDICAL OR VETERINARY SCIENCE; HYGIENE
- A61K—PREPARATIONS FOR MEDICAL, DENTAL OR TOILETRY PURPOSES
- A61K9/00—Medicinal preparations characterised by special physical form
- A61K9/48—Preparations in capsules, e.g. of gelatin, of chocolate
- A61K9/4891—Coated capsules; Multilayered drug free capsule shells
-
- A—HUMAN NECESSITIES
- A61—MEDICAL OR VETERINARY SCIENCE; HYGIENE
- A61P—SPECIFIC THERAPEUTIC ACTIVITY OF CHEMICAL COMPOUNDS OR MEDICINAL PREPARATIONS
- A61P3/00—Drugs for disorders of the metabolism
- A61P3/06—Antihyperlipidemics
-
- A—HUMAN NECESSITIES
- A61—MEDICAL OR VETERINARY SCIENCE; HYGIENE
- A61P—SPECIFIC THERAPEUTIC ACTIVITY OF CHEMICAL COMPOUNDS OR MEDICINAL PREPARATIONS
- A61P43/00—Drugs for specific purposes, not provided for in groups A61P1/00-A61P41/00
-
- A—HUMAN NECESSITIES
- A61—MEDICAL OR VETERINARY SCIENCE; HYGIENE
- A61P—SPECIFIC THERAPEUTIC ACTIVITY OF CHEMICAL COMPOUNDS OR MEDICINAL PREPARATIONS
- A61P9/00—Drugs for disorders of the cardiovascular system
-
- A—HUMAN NECESSITIES
- A61—MEDICAL OR VETERINARY SCIENCE; HYGIENE
- A61K—PREPARATIONS FOR MEDICAL, DENTAL OR TOILETRY PURPOSES
- A61K2300/00—Mixtures or combinations of active ingredients, wherein at least one active ingredient is fully defined in groups A61K31/00 - A61K41/00
Definitions
- compositions rich in omega-3 (“ ⁇ -3” or “n-3") polyunsaturated fatty acids (“PUFAs”) are being developed to treat a variety of clinical indications.
- omega-3 omega-3
- PUFAs polyunsaturated fatty acids
- These products which are derived from natural sources, typically fish oils, are heterogeneous compositions, and comprise various species of omega-3 PUFAs, omega-6 PUFAs, and other minor components, including mono-unsaturated and saturated fatty acids.
- the observed clinical effects are typically attributed to the composition as a whole, although the most prevalent of the PUFA species present in the mixture, usually EPA and DHA, are believed to contribute a substantial portion of the observed clinical effect. Because they are heterogeneous compositions, the products are defined to include certain obligate
- compositions are further defined to limit certain undesired components, both those originating in the natural source, such as certain environmental contaminants, and those potentially created in the refining process.
- the optimal composition likely differs as among intended clinical indications. Even for the first approved clinical indication, however, treatment of severe hypertriglyceridemia (TGs > 500 mg/dl), the optimal composition has not yet been defined.
- the first-approved pharmaceutical composition for treatment of severe hypertriglyceridemia comprises the omega-3 PUFA species eicosapentaenoic acid (“EPA”) and docosahexaenoic acid (“DHA”) in the form of ethyl esters in weight percentages of approximately 46:38 (EPA:DHA), with EPA and DHA together accounting for
- Vascepa ® previously known as AMRlOl
- AMRlOl the more recently approved product
- OMAX3 sold as a dietary supplement and promoted in part to lower triglyceride levels, comprises EPA and DHA in a weight ratio of about 4.1 :1, wherein the EPA and DHA are likewise in the ethyl ester form, the formulation being more than 84% EPA and DHA by weight and more than 90% omega-3 fatty acids by weight.
- omega-6 PUFA species arachidonic acid
- AA arachidonic acid
- the difficulty in defining an optimal composition is also due in part to enzymatic interconversion among certain omega-3 PUFA species, and to competition between omega-3 and omega-6 polyunsaturated fatty acids for shared enzymes in their respective biosynthetic pathways from medium chain dietary PUFAs ⁇ see FIG. 1).
- a further challenge in designing an optimal composition is variation in bioavailability of orally administered PUFA compositions.
- Absorption of PUFAs in the form of ethyl esters is known, for example, to depend on the presence of pancreatic lipase, which is released in response to ingested fats. Absorption of PUFA ethyl esters is therefore inefficient, and is subject to substantial variation, both among subjects and in any individual subject, depending on dietary intake of fat. See Lawson et ah, "Human absorption of fish oil fatty acids as triacylglycerols, free acids, or ethyl esters," Biochem Biophys Res Commun.
- the refining process is designed to produce a final product having the obligate fatty acid components within predefined percentage tolerance ranges and to limit certain undesired components to levels below certain pre-defined tolerance limits, with sufficient yield to make the process commercially feasible and environmentally sustainable. Differences in the desired final composition dictate differences in the refining process.
- urea inclusion complexation in the presence of ethanol is often used to remove saturated and mono-unsaturated long chain fatty acids, increasing the relative proportion of desired long chain omega-3 polyunsaturated fatty acids in the resulting composition. Too little urea reduces long chain omega-3 PUFA enrichment. Excess urea, however, can lead to concentration of unwanted components, and has the potential to lead, at any given temperature and reaction time, to increased production of ethyl carbamate, a carcinogen that is impermissible above certain defined low limits.
- Existing alternatives to urea can lead to concentration of unwanted components, and has the potential to lead, at any given temperature and reaction time, to increased production of ethyl carbamate, a carcinogen that is impermissible above certain defined low limits.
- the present disclosure provides DPA-enriched pharmaceutical compositions of omega-3 polyunsaturated fatty acids in free acid form. Enrichment in DPA content was an unintended and unexpected consequence of the commercial-scale production process. These DPA-enriched pharmaceutical compositions have been demonstrated to have exceptional pharmacological and clinical efficacy in in vitro experiments and in human clinical trials.
- methods of treatment are provided.
- methods of treating severe hypertriglyceridemia TGs > 500 mg/dL are provided.
- methods of treating are provided.
- hypertriglyceridemia 200 mg/dL - 500 mg/dL
- Further treatment methods include, inter alia, treatments to increase plasma EPA: AA ratios, treatments to decrease ApoCIII levels, and treatments to reduce or prevent resistance to platelet aggregation inhibitors.
- compositions at commercial scale including methods that include a urea complexation step in which compositionally-constrained batches of transesterified intermediate feedstock are subjected to a urea complexation step using urea amounts within ranges determined by a new process algorithm.
- FIG. 1 shows the known human pathways for biosynthesis of omega-3 and omega-6 long-chain polyunsaturated fatty acids from intermediate (medium) chain length essential fatty acids.
- FIG. 2 is flow chart of an exemplary process for preparing an intermediate feedstock of PUFA ethyl esters.
- FIG. 3A plots the average relative purification of classes of fatty acids by a urea complexation step in which algorithmically-determined amounts of urea are added to compositionally-defined intermediate feedstock of PUFA ethyl esters.
- FIG. 3B illustrates the average differential purification of individual species of omega-3 and omega-6 PUFA ethyl esters when algorithmically-determined amounts of urea are added to compositionally-defined intermediate feedstock of PUFA ethyl esters.
- FIG. 4 is a treatment flow diagram illustrating the design of the ECLIPSE clinical study further described in Example 7.
- FIG. 5 compares the bioavailability of total EPA + DHA (baseline-adjusted change) following a single dose (4 g) of Lovaza ® during the high-fat and low-fat diet periods.
- FIG. 6 compares the bioavailability of total EPA+DHA (baseline-adjusted change) following a single dose (4g) of Lovaza ® ("EE-FA”) or Epanova ® , a DPA-enriched composition of omega-3 PUFAs in free acid form (“FFA”), during the high-fat diet period.
- EE-FA Lovaza ®
- Epanova ® Epanova ®
- FFA free acid form
- FIG. 7 compares the total plasma EPA+DHA concentrations (baseline-adjusted change) following a single dose (4g) of Lovaza ® or Epanova ® during the low-fat diet period.
- FIG. 8 compares the total plasma EPA concentrations (baseline-adjusted change) following a single dose (4 g) of Lovaza ® or Epanova ® during the low-fat diet period.
- FIG. 9 compares the total plasma DHA concentrations (baseline-adjusted change) following a single dose of (4g) of Lovaza ® or Epanova ® during the low-fat diet period.
- FIGS. 10A and 10B present individual subject AUC 0-t responses during the low-fat and high-fat diets expressed as the ratio (%) of low-fat AUC 0-t to high-fat AUC 0-t . Negative ratios were not plotted.
- FIG. 11 is a treatment flow diagram illustrating the design of the 14 day comparative bioavailability trial further described in Example 8 (timeline not to scale).
- FIG. 12A plots the mean unadjusted total EPA+DHA concentrations versus time (linear scale) for treatment with Lovaza ® vs. treatment with Epanova ® in the 14 day comparative bioavailability trial further described in Example 8.
- FIG. 12B is a histogram showing the difference in unadjusted EPA+DHA (nmol/mL) for the points bracketed in FIG. 12 A.
- FIG. 13 plots EPA+DHA mean base-line adjusted plasma total EPA+DHA concentrations versus time (linear scale) for treatment with Lovaza ® vs. treatment with Epanova ® in the 14 day comparative bioavailability study.
- FIG. 14A is a histogram that plots the increases from baseline to steady state in unadjusted blood levels for EPA+DHA in the Lovaza ® and Epanova ® arms of the 14 day comparative bioavailability study.
- FIG. 14B is a histogram that plots the increases from baseline to steady state in unadjusted C avg for EPA+DHA in the Lovaza ® and Epanova ® arms of the 14 day
- FIG. 15A is a histogram that plots the increases from baseline to steady state for total blood levels of DHA in the Lovaza ® and Epanova ® arms of the 14 day comparative bioavailability study.
- FIG. 15B is a histogram that plots the increases from baseline to steady state for DHA Ca vg levels in the Epanova ® cohort compared to Lovaza ® cohort in the 14 day comparative bioavailability study.
- FIG. 16A is a histogram that plots the increases from baseline to steady state for total EPA levels in blood in the Lovaza ® and Epanova ® arms of the 14 day comparative bioavailability study.
- FIG. 16B plots the increases from baseline to steady state for EPA C avg levels in the Epanova ® and Lovaza ® cohorts in the 14 day comparative bioavailability study.
- FIG. 17 provides a treatment flow diagram illustrating the design of the EVOLVE study, further described in Example 10.
- FIG. 18 summarizes the EVOLVE trial design in greater detail, further identifying the timing of study visits.
- FIG. 19 shows the disposition of subjects in the EVOLVE trial.
- FIGS. 20 A - 20D display average baseline and end-of-treatment ("EOT") plasma levels (in ⁇ g/mL) for EPA (FIG. 20A), DHA (FIG. 20B), DPA (FIG. 20C) and AA (FIG. 20D), for each of the treatment arms in the EVOLVE trial.
- EOT end-of-treatment
- FIG. 20E compares average baseline and EOT EPA levels for the ECLIPSE trial described in Example 7, the 14-day bioavailability study described in Example 8, a statin drug-drug interaction study ("STATIN DDI") described in Example 11, each treatment arm as well as the control arm of the EVOLVE trial described in Example 10, and values earlier reported in the literature for the unrelated JELIS trial (“JELIS”), which used a different omega-3 composition.
- STATIN DDI statin drug-drug interaction study
- JELIS unrelated JELIS trial
- FIGS. 21 A - 21D plot median baseline and end-of-treatment ("EOT") plasma levels (in ⁇ ,) for EPA (FIG. 21 A), DHA (FIG. 21B), DPA (FIG. 21C), and AA (FIG. 21D) in the EVOLVE trial.
- EOT end-of-treatment
- FIGS. 22 A and 22B plot change from baseline to EOT in absolute plasma levels (in ⁇ g/mL) of AA, DHA, EPA, and DPA, for each of the treatment arms of the EVOLVE trial.
- FIG. 22A plots average changes;
- FIG. 22B plots median changes.
- FIG. 23 A plots average change from baseline to EOT, as percentage of baseline value, for AA, DHA, EPA, and DPA in each of the treatment arms of the EVOLVE trial.
- FIG. 23 B plots median percent change from baseline to EOT.
- FIGS. 24 A - 241 plot average baseline and EOT plasma levels (in mg/dL, with the exception of LpPLA2, shown in ng/mL) in the EVOLVE trial for triglycerides (FIG. 24A), Non-HDL-C (FIG. 24B), HDL-C (FIG. 24C), V-LDL-C (FIG. 24D), LDL-C (FIG. 24E), ApoB (FIG. 24F), ApoCIII (FIG. 24G), RLP (FIG. 24H), LpPLA2 (FIG. 241).
- FIGS. 25A - 251 plot median baseline and EOT plasma levels (in mg/dL, with the exception of LpPLA2, shown in ng/mL) in the EVOLVE trial for triglycerides (FIG. 25 A), Non-HDL-C (FIG. 25B), HDL-C (FIG. 25C), V-LDL-C (FIG. 25D), LDL-C (FIG. 25E), ApoB (FIG. 25F), ApoCIII (FIG. 25G), RLP (FIG. 25H), LpPLA2 (FIG. 251). [0047] FIGS.
- FIG. 26 A and 26B plot change from baseline to EOT in absolute plasma levels (in mg/dL) in the EVOLVE trial of triglycerides ("TG”), Non-HDL-C ("NHDL-C”), HDL-C, VLDL-C, and LDL-C for each of the treatment arms of the EVOLVE trial, with FIG. 26A plotting average change and FIG. 26B showing median change.
- TG triglycerides
- NHDL-C Non-HDL-C
- HDL-C high-HDL-C
- VLDL-C VLDL-C
- LDL-C LDL-C
- FIG. 27 plots the percentage of subjects in the EVOLVE trial, given by the Y-axis, for whom triglyceride levels were reduced by the indicated percentage, given by the X-axis, for 2g dose and 4g dose of Epanova ® .
- FIG. 28 A plots average change from baseline to EOT, as percentage of baseline value, for TG, non-HDL-c ("NHDL-C"), HDL-C, VLDL-C, LDL-C, ApoB, ApoCIII, LpLPA2, and RLP in each of the treatment arms of the EVOLVE trial, with FIG. 28B plotting median percent change from baseline to EOT.
- NHDL-C non-HDL-c
- FIG. 29 plots the rate of change (absolute value) of the median percentage change from baseline in plasma levels of EPA, DHA, DP A, AA, TG, NHDL-C, and HDL-C between 2g and 4g doses of Epanova ® in the EVOLVE trial .
- FIG. 30 illustrates comparative data for Epanova ® , as measured in the EVOLVE trial, and data reported by others for AMR-101 (Vascepa), at the indicated doses, with respect to TG levels.
- FIG. 31 illustrates comparative data for Epanova ® , as measured in the EVOLVE trial, and AMR-101 (Vascepa), with respect to various blood lipid parameters. Data for AMR-101 were reported by others. (*) indicates a p value of less than 0.05, (**) indicates a p value of less than 0.01, and (***) indicates a p value of less than 0.001.
- FIG. 32 illustrates comparative data for Epanova ® 2g and 4g doses, as determined in the EVOLVE trial, and Lovaza ® 4 g dose, with respect to various blood lipid parameters. Data for Lovaza ® were reported by others. (*) indicates a p value of less than 0.05, (**) indicates a p value of less than 0.01, and (***) indicates a p value of less than 0.001.
- FIG. 33 illustrates comparative data for Epanova ® 2g and 4g doses, as assessed in the EVOLVE trial, and Lovaza ® 4 g dose, as reported by others, with respect to TG levels.
- the superscripts indicate data sourced from (1) EVOLVE trial, (2) a meta-analysis from the Lovaza ® New Drug Application ("NDA") (3) Lovaza ® FDA-approved product Label and (4) Takeda study.
- (*) indicates a p value of less than 0.05
- (**) indicates a p value of less than 0.01
- (***) indicates a p value of less than 0.001.
- FIG. 34 plots the correlation between percent change in LDL and percent change in ApoCIII, as measured in the EVOLVE trial.
- FIG. 35 plots the least squares (LS) mean percentage change from baseline for the subset of EVOLVE trial subjects having TG baseline levels greater than or equal to 750 mg/dL, for the indicated treatment arms of the EVOLVE study, as further described in Example 10.
- (*) indicates a p value of less than 0.05
- (**) indicates a p value of less than 0.01
- (***) indicates a p value of less than 0.001.
- FIG. 36 plots the least squares (LS) mean percentage change from baseline for the subset of subjects having Type II diabetes, for the indicated treatment arms of the EVOLVE study, as described in Example 10.
- (*) indicates a p value of less than 0.05
- (**) indicates a value of less than 0.01
- (***) indicates a p value of less than 0.001.
- FIG. 37 plots the least squares (LS) mean percentage change from baseline for the subset of subjects undergoing concurrent statin therapy, for the indicated treatment arms of the EVOLVE study, as described in Example 10.
- (*) indicates a p value of less than 0.05
- (**) indicates a p value of less than 0.01
- (***) indicates a p value of less than 0.001.
- FIG. 38 plots the least squares (LS) mean percentage difference relative to control for triglycerides ("TG”), non-HDL-cholesterol ("NHDL-C”), HDL-C, LDL-C, TC, VLDL-C, and TC/HDL-C, comparing subjects from the EVOLVE study described in Example 10 who either received (STATIN) or did not receive (NON-STATIN) statin therapy concurrent with treatment with the 2g dose of Epanova ® .
- (*) indicates a p value of less than 0.05
- (**) indicates a p value of less than 0.01
- (***) indicates a p value of less than 0.001.
- FIG. 39 plots the median percent change from baseline for TG, NHDL-C, HDL-C, LDL-C, TC, VLDL-C, and TC/HDL-C for the subset of subjects undergoing concurrent statin therapy, in the indicated treatment arms of the EVOLVE study, further described in Example 10.
- (*) indicates a p value of less than 0.05
- (**) indicates a p value of less than 0.01
- (* * *) indicates a p value of less than 0.001.
- FIG. 40 provides a treatment flow diagram illustrating the design of the ESPRIT study, further described in Example 12.
- FIG. 41 shows the disposition of subjects in the ESPRIT trial.
- FIGS. 42A and 42B plot the median LS percentage change from baseline for EPA (FIG. 42 A) and DHA (FIG. 42B) from the ESPRIT study, further described in Example 12.
- (*) indicates a p value of less than 0.05
- (**) indicates a p value of less than 0.01
- (***) indicates a p value of less than 0.001.
- FIG. 43 plots mean LS percentage change from baseline for TG, Non-HDL-C, and HDL-C. Data shown are from the ESPRIT study, further described in Example 12. (*) indicates a p value of less than 0.05, (**) indicates a p value of less than 0.01, and (***) indicates a p value of less than 0.001.
- FIG. 44 plots mean LS percentage change from baseline for ApoB, LDL-C, VLDL-C, and TC/HDL-C. Data shown are from the ESPRIT study, further described in Example 12. (*) indicates a p value of less than 0.05, (**) indicates a p value of less than 0.01, and (***) indicates a p value of less than 0.001.
- FIG. 45 plots median percentage change from baseline for TG, with subjects grouped into tertiles by baseline TG levels, for subjects in the ESPRIT trial.
- FIG. 46 plots median percentage change from baseline for Non-HDL-C, with subjects grouped into tertiles by baseline Non-HDL-C levels, for subjects in the ESPRIT trial.
- FIG. 47 plots median percentage change from baseline for LDL-C, with subjects grouped into tertiles by baseline LDL-C levels, for subjects in the ESPRIT trial.
- FIG. 48 plots median percentage change from baseline for TG for each of the treatment arms of the ESPRIT trial, with subjects grouped according to the identity of the statin taken in concurrent therapy.
- FIG. 49 plots median percentage change from baseline for TG for each of the treatment arms of the ESPRIT trial, with subjects grouped into two groups according to low or high potency concurrent statin therapy.
- FIG. 50 plots median percentage change from baseline for Non-HDL-C for each of the treatment arms of the ESPRIT trial, with subjects grouped according to low or high potency concurrent statin therapy.
- FIG. 51 plots median percentage change from baseline for LDL-C for each of the treatment arms of the ESPRIT trial, with subjects grouped into two groups according to low or high potency concurrent statin therapy.
- FIG. 52 plots median percentage change from baseline for TG, with subjects in each treatment arm of the ESPRIAT trial grouped into three groups according to high baseline TG, high baseline EPA, or concurrent rosuvastatin therapy.
- FIG. 53 plots mean LS percentage change in particle size distribution from baseline for V-LDL particles grouped by size, as determined in the ESPRIT trial.
- (*) indicates a p value of less than 0.05
- (**) indicates a p value of less than 0.01
- (***) indicates a p value of less than 0.001.
- FIG. 54 plots mean LS percentage change in particle size distribution from baseline for LDL particles grouped by size for each of the treatment arms of the ESPRIT trial.
- FIG. 55 plots LS median percentage change in LDL particle size, with subjects grouped into three groups according to ESPRIT EOT triglyceride levels.
- FIG. 56A depicts baseline arachidonic acid (AA) plasma levels (in ⁇ / ⁇ for subjects in the clinical trial further described in Example 11, grouped according to genotype at the rs 174546 SNP.
- FIG. 56B depicts percent change from baseline in AA plasma levels at day 15 of treatment with Epanova ® , grouped according to genotype at the rsl74546 SNP.
- the interquartile range is indicated by a box
- the median is indicated by a horizontal line in the interior of the interquartile box
- the mean is represented by a diamond.
- Outliers are represented by open circles. The whiskers extend to the minimum and maximum non-outlier value.
- Score 1 identifies subjects who are homozygous at the major allele
- Score 3 identifies subjects homozygous at the minor allele
- Score 2 represents heterozygotes.
- Urea inclusion complexation is a standard step often used in the refining of fish oils to remove saturated and mono-unsaturated long chain fatty acids, thus enriching for desired long chain omega-3 polyunsaturated fatty acids in the resulting composition.
- clathration is a standard step often used in the refining of fish oils to remove saturated and mono-unsaturated long chain fatty acids, thus enriching for desired long chain omega-3 polyunsaturated fatty acids in the resulting composition.
- Example 2 As described in Example 2, four exemplary production batches of polyunsaturated fatty acids in free acid form were prepared using a urea complexation step. Strict compositional controls were applied to the ethyl ester intermediate feedstock, using only batches in which specified species of polyunsaturated fatty acids fell within defined range limits, and urea amounts were used that fell within the range required by the urea calculator algorithm. All four production batches of the pharmaceutical composition were determined to meet the desired compositional specifications.
- the urea complexation step substantially decreased the percentage of saturated fatty acids and mono-unsaturated fatty acids in the resulting composition, thereby substantially enriching for polyunsaturated fatty acids. See FIG. 3 A. Unexpectedly, however, performing urea complexation using urea amounts falling within the
- compositional analysis of 10 batches of API demonstrated reproducibly elevated levels of DPA in the final composition.
- compositional analysis of 21 batches prepared using urea complexation demonstrated a reproducible 10-fold difference in the concentration of the omega-3 species, DPA, as compared to its omega-6 isomer, docosapentaenoic acid (C22:5 n-6).
- DPA is the third most prevalent species of polyunsaturated fatty acid in the API, exceeded only by EPA and DHA. At this level, the DPA concentration is also approximately 10-fold greater than that reported for an earlier pharmaceutical composition of omega-3 polyunsaturated fatty acids in free acid form, termed Purepa, in which DPA was reported to be present at a level of 0.5%. See Belluzzi et al, Dig. Dis. Sci. 39(12): 2589-2594 (1994).
- DPA is an intermediate in the biosynthetic pathway from EPA to DHA (see FIG. 1), surprisingly little is known about the DP As specific biological effects.
- gene expression profiling experiments were conducted using HepG2 hepatocarcinoma cells.
- DPA was observed to affect expression of genes in multiple metabolic pathways, including genes in categories known to be relevant to the clinical effects of omega-3 polyunsaturated fatty acids: genes involved in lipid metabolism, genes involved in cardiovascular physiology, and genes involved in inflammation.
- DPA DPA-driven upregulation of ACADSB, the short/branched chain acyl-CoA dehydrogenase, predicts lower serum triglyceride levels
- DPA-driven downregulation of HMGCR analogous to inhibition of the encoded HMG-CoA-reductase enzyme by statins, would be predicted to lead to favorable decreases in the total cholesterol :HDL ratio
- DPA downregulation of SQLE a rate- limiting step in sterol synthesis, analogously predicts reductions in total cholesterol levels.
- the expression profiling experiments also demonstrated a dose threshold for DPA's effects.
- the lower concentration tested chosen to mimic the 10-fold lower concentration of DPA in the earlier free acid omega-3 formulation, Purepa, affected the expression of 10-fold fewer genes than the higher DPA concentration, chosen to mimic the exposure expected from the pharmaceutical compositions described herein, demonstrating that the lower DPA concentration provides subthreshold exposure, and would be expected to provide a subtherapeutic dose in vivo.
- Example 7 presents the results of the ECLIPSE clinical trial, an open-label, single dose, randomized 4-way-crossover study comparing the bioavailability of a 4g dose of Lovaza® to bioavailability of a 4g dose of the DPA-enriched pharmaceutical composition of omega-3 PUFA in free acid form described herein (hereinafter, "Epanova®”), under both high fat and low fat dietary conditions.
- each 1-gram capsule of Lovaza® contains at least 900 mg of the ethyl esters of omega-3 fatty acids sourced from fish oils, predominantly a combination of ethyl esters of eicosapentaenoic acid (EPA - approximately 465 mg) and docosahexaenoic acid (DHA - approximately 375 mg).
- the batch of Epanova® used in the trial comprised 57.3% (a/a) EPA, 19.6% (a/a) DHA, and 6.2% (a/a) DPA, each substantially in free acid form.
- Example 8 presents results from a 14-day bioavailability study, which demonstrated that the increase in bioavailability observed in the single-dose ECLIPSE trial is maintained, even enhanced, over 2 weeks of dosing.
- disaggregated subject-specific data demonstrated that the subject with least response to Epanova® still had a greater day- 14 EPA+DHA Cmax than the subject with best response to Lovaza®.
- Example 10 presents the results of the EVOLVE trial, a 12- week, double-blind, olive oil-controlled study of patients selected on the basis of high triglyceride levels, in the range of 500-2,000 mg/dL (severe hypertriglyceridemia).
- the primary study endpoint was percent change in plasma triglyceride levels from baseline to end-of-treatment ("EOT”).
- the secondary endpoint was percent change in plasma non-HDL cholesterol ("non-HDL-C”) from baseline to EOT.
- Apolipoprotein CIII was significantly reduced by Epanova ® treatment. Elevated levels of ApoCIII have been found to be an independent predictor for cardiovascular heart disease (CHD) risk, whereas genetically reduced levels of ApoCIII have been associated with protection from CHD, and have also been correlated with increase in longevity.
- CHD cardiovascular heart disease
- FIG. 29 plots the rate of change in the median percentage change from baseline in plasma levels of EPA, DHA, DP A, AA, TG, non-HDL-C, and HDL-C (absolute value) between 2g and 4g doses of Epanova ® .
- the rate of change (slope) in the median percentage change from baseline is near zero, predicting little further increase in DHA and DPA plasma levels would be achieved if dose is further increased. Similar plateauing of response was seen in triglyceride levels, HDL-C levels, and non-HDL- C levels (data not shown).
- a subset of subjects in the 2g treatment arm of the EVOLVE trial who were receiving concurrent statin therapy displayed greater magnitudes of percentage changes (mean LS difference), relative to control, for TG, non-HDL-C, HDL-C, LDL-C, TC, VLDL-C, and TC/HDL-C, when compared to those subjects in the 2g treatment arm who did not receive concurrent statin therapy.
- Subjects receiving concurrent statin therapy showed a dose-dependent response to Epanova ® , as shown in comparative data for Epanova ® 2g and Epanova ® 4g displayed in FIG. 39.
- Example 12 describes the ESPRIT clinical trial, which was conducted to study patients on baseline statin therapy with triglyceride levels between 200-500 mg/dL, lower than the patients with severe hypertriglyceridemia enrolled in the EVOLVE study described in Example 10.
- FIGS. 45 - 52 illustrate that Epanova ® is efficacious as an add-on to both low-potency and high-potency statins, in a range of baseline patient conditions.
- FIG. 48 the reductions in TG levels were observed for patients who received concurrent rosuvastatin, atorvastatin, and simvastatin therapy.
- Statistically significant effects on triglycerides, non-HDL-C, and LDL-C levels were observed regardless whether low potency or high potency statins were co-administered, as shown in FIGS. 49 - 51.
- compositions of polyunsaturated fatty acids ("PUFAs") in free acid form are provided.
- the composition is a pharmaceutical composition suitable for oral administration.
- the composition is a neutraceutical composition suitable for oral administration. 5.2.1. Typical embodiments
- composition comprises a plurality of species of omega-3 PUFA, each present substantially in free acid form.
- the composition comprises eicosapentaenoic acid (C20:5 n-3) ("EPA,” also known as timnodonic acid), docosahexaenoic acid (C22:6 n-3) (“DHA,” also known as cervonic acid), and docosapentaenoic acid (C22:5 n-3) ("DP A”, also known as clupodonic acid), each substantially in free acid form.
- EPA eicosapentaenoic acid
- DHA docosahexaenoic acid
- DP A docosapentaenoic acid
- the composition comprises EPA in an amount, calculated as a percentage by area on GC chromatogram of all fatty acids in the composition, of at least about 45% ("45% (a/a)"). In various embodiments, the composition comprises EPA in an amount of at least about 46% (a/a) 47% (a/a), 48% (a/a), 49% (a/a), or at least about 50% (a/a). In certain embodiments,
- the composition comprises EPA in an amount of at least about 51% (a/a), at least about 52% (a/a), at least about 53% (a/a), at least about 54% (a/a), at least about 55% (a/a), at least about 56% (a/a), at least about 57% (a/a), at least about 58% (a/a), even at least about 59% (a/a), at least about 60% (a/a), at least about 61% (a/a), 62% (a/a), 63% (a/a), 64% (a/a), or 65% (a/a).
- the composition comprises EPA in an amount of about 45 to about 65% (a/a). In particular embodiments, EPA is present in an amount of about 50 to about 60% (a/a). In various embodiments, EPA is present in an amount of about 52 to about 58.0 % (a/a). In some embodiments, EPA is present in an amount of about 55% (a/a) to about 56% (a/a). In some embodiments, EPA is present in an amount of about 55% (a/a).
- the composition comprises EPA in an amount, calculated as a percentage by mass of all fatty acids in the composition ("% (m/m)"), of about 50% (m/m) to about 60 % (m/m). In certain embodiments, EPA is present in an amount of about 55% (m/m).
- the composition comprises DHA in an amount of at least about 13% (a/a). In various embodiments, the composition comprises DHA in an amount of at least about 14% (a/a), at least about 15% (a/a), at least about 16% (a/a), at least about 17% (a/a), at least about 18% (a/a), at least about 19% (a/a), or at least about 20% (a/a). In selected embodiments, the composition comprises DHA in an amount of at least about 21% (a/a), at least about 22% (a/a), at least about 23% (a/a), at least about 24% (a/a), even at least about 25% (a/a).
- the composition comprises DHA in an amount of about 13% (a/a) to about 25 % (a/a). In certain embodiments, DHA is present in an amount of about 15% (a/a) to about 25% (a/a). In several embodiments, DHA is present in an amount of about 17% (a/a) to about 23 % (a/a). In certain embodiments, DHA is present in an amount of about 19% (a/a) to about 20% (a/a).
- compositions comprise DHA in an amount of about 15% (m/m) to about 25% (m/m). In certain embodiments, DHA is present in an amount of about 17% (m/m) to about 23% (m/m). In certain embodiments, DHA is present in an amount of about 20% (m/m).
- the composition comprises DPA in an amount of at least about 1% (a/a). In various embodiments, the composition comprises DPA in an amount of at least about 1.5% (a/a), 2% (a/a), 2.5% (a/a), 3% (a/a), 3.5% (a/a), 4% (a/a), 4.5% (a/a), even at least about 5% (a/a). In selected embodiments, the composition comprises DPA in an amount of at least about 6% (a/a), at least about 7% (a/a), at least about 8% (a/a), or at least about 9% (a/a).
- the composition comprises DPA in an amount of about 1% (a/a) to about 8% (a/a). In certain embodiments, the composition comprises DPA in an amount of about 2% (a/a) to about 7% (a/a). In selected embodiments, the composition comprises DPA in an amount of about 3% (a/a) to about 6% (a/a). In particular
- the composition comprises DPA in an amount of about 4% (a/a) to about 5% (a/a).
- the composition comprises DPA, calculated as a percentage by mass of all fatty acids in the composition, in an amount of no less than about 1% (m/m). In various embodiments, the composition comprises DPA in an amount of about 1% (m/m) to about 8% (m/m). In particular embodiments, the composition comprises DPA in an amount of no more than about 10% (m/m). [0121] The composition comprises EPA and DHA in a total amount of at least about 60% (a/a).
- the composition comprises EPA and DHA in a total amount of at least about 61% (a/a), 62% (a/a), 63% (a/a), 64% (a/a), 65% (a/a), 66% (a/a), 67% (a/a), 68% (a/a), 69% (a/a), or at least about 70% (a/a).
- the composition comprises EPA and DHA in a total amount of at least about 61% (a/a), 62% (a/a), 63% (a/a), 64% (a/a), 65% (a/a), 66% (a/a), 67% (a/a), 68% (a/a), 69% (a/a), or at least about 70% (a/a).
- the composition comprises EPA and DHA in a total amount of at least about 61% (a/a), 62% (a/a), 63% (a/a), 64% (a/a), 65% (a/a), 66% (a/a), 67% (a/a), 68% (a
- composition comprise EPA and DHA in a total amount off at least about 71% (a/a),
- the composition comprises EPA and DHA in total amount of at least about 81% (a/a), 82% (a/a), at least about 83% (a/a), 84% (a/a), even at least about 85% (a/a).
- the composition comprises EPA and DHA in an amount of about 70.0 % (m/m) to about 80.0% (m/m). In certain embodiments, the composition comprises about 75% (m/m) EPA plus DHA.
- the composition comprises EPA, DHA, and DPA in a total amount of at least about 61% (a/a).
- the composition comprises EPA, DHA, and DPA in a total amount of at least about 62% (a/a), 63% (a/a), 64% (a/a), 65% (a/a), 66% (a/a), at least about 67% (a/a), at least about 68% (a/a), at least about 69% (a/a), or at least about 70% (a/a).
- the composition comprises EPA, DHA, and DPA in a total amount of at least about 71% (a/a), 72% (a/a), 73% (a/a), 74% (a/a), 75% (a/a), 76% (a/a), 77% (a/a), 78% (a/a), 79% (a/a), 80% (a/a), even at least about 81% (a/a), 82% (a/a), 83% (a/a), 84% (a/a), 85% (a/a), 86% (a/a), 87% (a/a), even at least about 88% (a/a).
- the composition comprises EPA, DHA, and DPA in a total amount of between about 70% (a/a) to about 90% (a/a).
- EPA is present in an amount of about 55% (a/a) to about 56% (a/a);
- DHA is present in an amount of about 19% (a/a) to about 20% (a/a); and
- DPA is present in an amount of about 4% (a/a) to about 5 % (a/a).
- the composition further comprises one or more omega-3 polyunsaturated fatty acid species selected from the group consisting of: a-linolenic acid (CI 8:3 n-3), moroctic acid (CI 8:4 n-3, also known as stearidonic acid), eicosatrienoic acid (C20:3 n-3), eicosatetraenoic acid (C20:4 n-3), and heneicosapentaenoic acid (C21:5 n-3).
- omega-3 polyunsaturated fatty acid species selected from the group consisting of: a-linolenic acid (CI 8:3 n-3), moroctic acid (CI 8:4 n-3, also known as stearidonic acid), eicosatrienoic acid (C20:3 n-3), eicosatetraenoic acid (C20:4 n-3), and heneicosapentaenoic acid (C21:5 n-3).
- the composition comprises EPA, DHA, DP A, and moroctic acid, each substantially in the free acid form.
- the composition comprises EPA, DHA, DP A, moroctic acid, and heneicosapentaenoic acid, each substantially in the free acid form.
- the composition comprises EPA, DHA, DP A, moroctic acid, heneicosapentaenoic acid, and eicosatetraenoic acid, each substantially in the free acid form.
- the composition comprises EPA, DHA, DP A, a-linolenic acid (CI 8:3 n-3), moroctic acid (CI 8:4 n-3), eicosatrienoic acid (C20:3 n-3), eicosatetraenoic acid (C20:4 n-3), and heneicosapentaenoic acid (C21:5 n-3).
- total omega-3 fatty acids defined as the sum of alpha- linolenic acid (CI 8:3 n-3), moroctic acid (CI 8:4 n-3), eicosatrienoic acid (C20:3 n-3), eicosatetraenoic acid (C20:4 n-3), eicosapentaenoic acid (EPA) (C20:5 n-3),
- docosahexaenoic acid (DHA) (C22:6 n-3) - constitute from about 80% (a/a) to about 95% (a/a) of all fatty acids in the composition.
- total omega-3 fatty acids constitute from about 80 - about 95% (m/m) of all fatty acids in the composition.
- the composition further comprises one or more species of omega-6 PUFA, each present substantially in the free acid form.
- the composition comprises one or more species of omega-6 PUFA selected from the group consisting of linoleic acid (CI 8:2 n-6), gamma-linolenic acid (CI 8:3 n-6), eicosadienoic acid (C20:2 n-6), dihomo-gamma-linolenic acid (C20:3 n-6) ("DGLA”), arachidonic acid (C20:4 n-6) ("AA”), and docosapentaenoic acid (C22:5 n-6, also known as osbond acid).
- omega-6 PUFA selected from the group consisting of linoleic acid (CI 8:2 n-6), gamma-linolenic acid (CI 8:3 n-6), eicosadienoic acid (C20:2 n-6), dihomo-gamma-linolenic acid (C20:3 n-6) ("DGLA”), arachidonic acid (C20
- the composition comprises linoleic acid (CI 8:2 n-6), gamma-linolenic acid (CI 8:3 n-6), eicosadienoic acid (C20:2 n-6), dihomo-gamma-linolenic acid (C20:3 n-6) ("DGLA”), arachidonic acid (C20:4 n-6) ("AA”), and docosapentaenoic acid (C22:5 n-6), each present substantially in the free acid form.
- DGLA dihomo-gamma-linolenic acid
- AA arachidonic acid
- C22:5 n-6 docosapentaenoic acid
- AA is present in an amount of no more than about 5% (a/a) of the fatty acids in the composition. In certain embodiments, AA comprises no more than about 4.5% (a/a) of the fatty acids in the composition. In particular embodiments, AA is present in an amount of no more than about 4% (a/a) of the fatty acids in the composition.
- AA is present in an amount of no more than about 5% (m/m) of the fatty acids in the composition. In certain embodiments, AA comprises no more than about 4.5% (m/m) of the fatty acids in the composition. In particular embodiments, AA is present in an amount of no more than about 4% (m/m) of the fatty acids in the composition.
- total omega-6 polyunsaturated fatty acids defined as the sum of linoleic acid (C18:2 n-6), gamma-linolenic acid (C18:3 n-6), eicosadienoic acid (C20:2 n-6), dihomo-gamma-linolenic acid (C20:3 n-6), arachidonic acid (C20:4 n-6) and docosapentaenoic acid (C22:5 n-6) - comprise no more than about 10% (a/a) of the fatty acids in the composition.
- total omega-6 polyunsaturated fatty acids defined as the sum of linoleic acid (CI 8:2 n-6), gamma-linolenic acid (CI 8:3 n-6), eicosadienoic acid (C20:2 n-6), dihomo-gamma-linolenic acid (C20:3 n-6), arachidonic acid (C20:4 n-6) and docosapentaenoic acid (C22:5 n-6) - comprise no more than about 10% (m/m) of the fatty acids in the composition.
- composition is given by Table 11, with each species of PUFA identified therein falling within the range of about -3SD to about +3 SD of the respectively recited average. In certain embodiments, each species of PUFA identified therein falls within the range of about -2SD to about +2 SD of the respectively recited average. In certain embodiments, each species falls within the range of about -ISD to about +1SD of the respectively recited average.
- composition is given by Table 13, with each species of PUFA identified therein falling within the range of about -3SD to about +3 SD of the respectively recited average. In certain embodiments, each species falls within the range of about -2SD to about +2 SD of the respectively recited average. In certain embodiments, each PUFA species falls within the range of about -1SD to about +1SD of the respectively recited average.
- polyunsaturated fatty acids other than omega-3 and omega-6 polyunsaturated fatty acids are present in an amount of no more than about 5% (a/a). In various embodiments, polyunsaturated fatty acids other than omega-3 and omega-6 polyunsaturated fatty acids are present in an amount of no more than about 5% (m/m).
- At least 90% of each of the plurality of species of omega-3 PUFA in the composition is in the free acid form. In certain embodiments, at least 91%, at least 92%, at least 93%, at least 94%, at least 95%, at least 96%, at least 97%, at least 98%, even at least 99% of each species of omega-3 PUFA in the composition is present in the free acid form. In exemplary embodiments, at least 90% of the total omega-3
- polyunsaturated fatty acid content in the composition is present in the free acid form.
- at least 91%, at least 92%, at least 93%, at least 94%, at least 95%, at least 96%, at least 97%, at least 98%, even at least 99% of the total omega-3 polyunsaturated fatty acid content in the composition is present in the free acid form.
- At least 90% of each of the plurality of species of omega-6 PUFA in the composition is in the free acid form. In certain embodiments, at least 91%, at least 92%, at least 93%, at least 94%, at least 95%, at least 96%, at least 97%, at least 98%, even at least 99% of each species of omega-6 PUFA in the composition is present in the free acid form. In exemplary embodiments, at least 90% of the total omega-6 polyunsaturated fatty acid content in the composition is present in the free acid form.
- At least 90% of the total polyunsaturated fatty acid in the composition is present in the free acid form. In certain embodiments, at least 91%, at least 92%, at least 93%, at least 94%, at least 95%, at least 96%, at least 97%, at least 98%, even at least 99% of the total polyunsaturated fatty acid in the composition is present in the free acid form.
- the composition comprises, in typical embodiments, no more than about 3.0% (a/a) saturated fatty acids and no more than about 5.0% (a/a) mono-unsaturated fatty acids. In various embodiments, the composition comprises no more than about 3.0% (m/m) saturated fatty acids and no more than about 5.0% (m m) mono-unsaturated fatty acids.
- the composition usefully further comprises an antioxidant.
- the antioxidant is butylated hydroxyanisole (BHA).
- BHA butylated hydroxyanisole
- the antioxidant is alpha-tocopherol.
- alpha-tocopherol is present in an amount of about 0.20 - about 0.40% (m m).
- alpha- tocopherol is present in an amount of about 0.25 - about 0.35% (m m).
- alpha-tocopherol is present in an amount of about 0.27 - about 0.33% (m/m).
- the composition comprises no more than about 0.1 ppm ethyl carbamate. In some embodiments, the composition comprises no more than 0.1 ppm ethyl carbamate. In various embodiments, the composition comprises less than 0.1 ppm ethyl carbamate.
- the composition comprises EPA in an amount, calculated as a percentage by area on GC chromatogram of all fatty acids in the composition, of about 45.0 - about 65.0% (a/a). In certain embodiments, EPA is present in an amount of about 50.0 - about 60.0 % (a/a). In various embodiments, EPA is present in an amount of about 52.0 - about 58.0 % (a/a). In some embodiments, EPA is present in an amount of about 55.0% (a/a).
- EPA is present in an amount of about 55.0 - about 58.4 % (a/a). In various embodiments, EPA is present in an amount of about 55.6 - about 57.9 % (a/a). In some embodiments, EPA is present in an amount of about 56.7% (a/a).
- the composition comprises EPA in an amount, calculated as a percentage by mass of all fatty acids in the composition, of about 50.0 - 60.0% (m/m). In certain embodiments, EPA is present in an amount of about 55% (m/m).
- the composition comprises DHA in an amount, calculated as a percentage by area on GC chromatogram of all fatty acids in the composition, of about 13.0 - about 25.0 % (a/a). In certain embodiments, DHA is present in an amount of about 15.0 - about 23.0% (a/a). In various embodiments, DHA is present in an amount of about 17.0 - about 21.0% (a/a). In certain embodiments, DHA is present in an amount of about 19.0 - about 20.0% (a/a).
- DHA is present in an amount of about 17.7 - about 22.2% (a/a). In various embodiments, DHA is present in an amount of about 18.4 - about 21.4% (a/a). In certain embodiments, DHA is present in an amount of about 19.9% (a/a).
- the compositions comprises DHA, calculated as a percentage by mass of all fatty acids in the composition, in an amount of about 15.0 - 25.0% (m/m). In certain embodiments, DHA is present in an amount of about 20.0% (m/m).
- the composition comprises EPA and DHA in a total amount, calculated as a percentage by area on GC chromatogram of all fatty acids in the composition, of about 67.0 - about 81.0 % (a/a). In certain embodiments, the composition comprises a total amount of EPA and DHA of about 69.0 - about 79.0% (a/a). In various embodiments, the composition comprises a total amount of EPA plus DHA of about 71.0 - about 77.0% (a/a). In certain embodiments, the composition comprises a total amount of EPA+DHA of about 74.0 - about 75.0% (a/a).
- the composition comprises EPA+DHA in a total amount, calculated as a percentage by mass of all fatty acids in the composition, of about 70.0-80.0% (m/m). In certain embodiments, the composition comprises about 75.0% (m/m) EPA plus DHA.
- a-linolenic acid is present in an amount of about 0.07 - about 1.10% (a/a). In certain embodiments, ⁇ -linolenic acid is present in an amount of about 0.24 - about 0.91% (a/a). In various embodiments, ⁇ -linolenic acid is present in an amount of about 0.40 - about 0.80 % (a/a). In certain embodiments, a-linolenic acid is present in an amount of about 0.50 to about 0.600% (a/a).
- moroctic acid is present in an amount of about 0.01 - about 7.90% (a/a). In certain embodiments, moroctic acid is present in an amount of about 0.25 - about 6.40% (a/a). In certain embodiments, moroctic acid is present in amount of about 1.70% - about 4.90% (a/a). In particular embodiments, moroctic acid is present in an amount of about 3.25% (a/a).
- eicosatrienoic acid is present in an amount of about 0.75 - about 3.50% (a/a). In certain embodiments, eicosatrienoic acid is present in an amount of about 1.20 - about 3.00% (a/a), in various embodiments, eicosatrienoic acid is present in an amount of about 1.60 - about 2.60% (a/a). In certain embodiments, eicosatrienoic acid is present in an amount of about 2.10% (a/a).
- eicosatetraenoic acid is present in an amount of about 0.01 - about 0.40% (a/a). In certain embodiments, eicosatetraenoic acid is present in an amount of about 0.01 - about 0.30% (a/a). In some embodiments, eicosatetraenoic acid is present in an amount of about 0.03 - about 0.22% (a/a). In some embodiments, eicosatetraenoic acid is present in an amount of about 0.12% (a/a).
- heneicosapentaenoic acid is present in an amount of about 0.01 - 4.10% (a/a). In certain embodiments, heneicosapentaenoic acid is present in an amount of about 0.01 - about 3.20% (a/a). In particular embodiments, heneicosapentaenoic acid is present in an amount of about 0.60 - about 2.35% (a/a). In various embodiments, heneicosapentaenoic acid is present in an amount of about 1.50% (a/a).
- DPA is present in an amount of about 0.90 - about 7.60% (a/a). In a variety of embodiments, DPA is present in an amount of about 2.00 - about 6.50% (a/a). In certain embodiments, DPA is present in an amount of about 3.10 - about 5.40% (a/a). In various embodiments, DP A is present in an amount of about 4.25% (a/a).
- DPA is present in an amount of about 2.13 - about 8.48% (a/a). In certain embodiments, DPA is present in an amount of about 3.19 - about 7.42% (a/a). In some embodiments, DPA is present in an amount of about 4.25 - about 6.37% (a/a). In various embodiments, DPA is present in an amount of about 5.31% (a/a).
- total omega-3 fatty acids comprise from about 80.0 - about 95% (m/m) of all fatty acids in the pharmaceutical composition.
- DGLA is present in an amount, calculated as a percentage by area on GC chromatogram of all fatty acids in the composition, of about 0.01 - about 4.40% (a/a). In some embodiments, DGLA is present in an amount of about 0.01 - about 3.30% (a/a). In certain embodiments, DGLA is present in an amount of about 0.01 - about 2.20% (a/a). In some embodiments, DGLA is present in an amount of about 1.10% (a/a).
- DGLA is present in an amount of about 0.28 - about 0.61% (a/a). In certain embodiments, DGLA is present in an amount of about 0.33 - about 0.56% (a/a). In some embodiments, DGLA is present in an amount of about 0.44% (a/a).
- AA is present in an amount, calculated as a percentage by area on GC chromatogram of all fatty acids in the composition, of about 0.01 - about 6.90% (a/a). In various embodiments, AA is present in an amount of about 0.01 - about 5.40% (a/a). In certain embodiments, AA is present in an amount of about 0.70 - about 3.80% (a/a). In a number of embodiments, AA is present in an amount of about 2.25% (a/a).
- AA is present in an amount of about 1.41 - about 4.87% (a/a). In certain embodiments, AA is present in an amount of about 1.99 - about 4.30%» (a/a). In a number of embodiments, AA is present in an amount of about 2.57 - about 3.72% (a/a). [0164] In various embodiments, the composition comprises AA in an amount of no more than about 4.5% (a/a). In some embodiments, the composition comprises AA in an amount of no more than about 3.14% (a/a).
- linoleic acid is present in an amount of about 0.25% - about 1.30 % (a/a). In certain embodiments, linoleic acid is present in an amount of about 0.40% - about 1.20% (a/a). In various embodiments, linoleic acid is present in an amount of about 0.60% - about 0.95% (a/a). In particular embodiments, linoleic acid is present in an amount of about 0.80%) (a/a).
- gamma-linolenic acid is present in an amount of about 0.01 - about 0.65% (a/a). In various embodiments, gamma-linolenic acid is present in an amount of about 0.03 - about 0.51% (a/a). In certain embodiments, gamma-linolenic acid is present in an amount of about 0.15 - about 0.40% (a/a). In several embodiments, gamma-linolenic acid is present in an amount of about 0.27% (a/a).
- eicosadienoic acid is present in an amount of about 0.01- about 0.30 (a a). In various embodiments, eicosadienoic acid is present in an amount of about 0.04 - about 0.24% (a/a). In certain embodiments, eicosadienoic acid is present in an amount of about 0.09 - about 0.20% (a/a). In some embodiments, eicosadienoic acid is present in an amount of about 0.14% (a/a).
- docosapentaenoic acid is present in an amount of about 0.01 - 0.95% (a/a). In various embodiments, docosapentaenoic acid (C22:5 n-6)is present in an amount of about 0.01 - about 1.05% (a/a). In some embodiments, docosapentaenoic acid (C22:5 n-6)is present in an amount of about 0.05 - about 0.71% (a/a).
- docosapentaenoic acid (C22:5 n-6) is present in an amount of about 0.01 - about 0.48% (a/a). In particular embodiments, docosapentaenoic acid (C22:5 n-6) is present in an amount of about 0.24% (a/a). [0169] In some embodiments, docosapentaenoic acid (C22:5 n-6) is present in an amount of about 0.01 - about 1.19% (a/a). In certain embodiments, docosapentaenoic acid (C22:5 n-6) is present in an amount of about 0.16 - about 0.98% (a/a). In particular embodiments, docosapentaenoic acid (C22:5 n-6) is present in an amount of about 0.57% (a/a).
- the composition comprises no more than about 10.0% (a/a) total omega-6 fatty acids.
- the composition comprises, in typical embodiments amongst these additional embodiments, no more than about 3.0% (a/a) saturated fatty acids, no more than about 5.0% (a/a) mono-unsaturated fatty acids, and no more than about 0.1 ppm ethyl carbamate. In some embodiments, the composition comprises no more than 0.1 ppm ethyl carbamate. In various embodiments, the composition comprises less than 0.1 ppm ethyl carbamate.
- the pharmaceutical or neutraceutical composition of DPA-enriched omega-3 PUFAs in free acid form described in Section 5.2 above is usefully packaged in unit dosage forms for oral administration.
- the dosage form is a capsule.
- the dosage form is a gelatin capsule.
- the gelatin capsule is a hard gelatin capsule.
- the dosage form is a soft gelatin capsule.
- the capsule comprises Type A gelatin. In some embodiments, the capsule comprises Type A gelatin.
- the capsule comprises both Type A and Type B gelatin.
- Sources of collagen for the production of either type A or type B gelatin include, but are not limited to, cows, pigs and fish.
- the capsule is a soft gelatin capsule comprising sufficient porcine Type A gelatin such that the capsule disintegrates within a time period of not more than 30 minutes in purified water at 37°C after storage for at least 3 months at 40°C.
- the capsule is a soft gelatin capsule comprising sufficient porcine Type A gelatin such that the capsule disintegrates within a time period of not more than 30 minutes in purified water at 37°C after storage for 6 months at 40°C.
- the capsule is a soft gelatin capsule comprising sufficient porcine Type A gelatin such that the capsule disintegrates within a time period of not more than 30 minutes in purified water at 37°C after storage for 12 months at 40°C.
- the capsule is a soft gelatin capsule comprising sufficient porcine Type A gelatin such that the capsule disintegrates within a time period of not more than 30 minutes in purified water at 37°C after storage for at least 3 months at 30°C.
- the capsule is a soft gelatin capsule comprising sufficient porcine Type A gelatin such that the capsule disintegrates within a time period of not more than 30 minutes in purified water at 37°C after storage for 6 months at 30°C.
- the capsule is a soft gelatin capsule comprising sufficient porcine Type A gelatin such that the capsule disintegrates within a time period of not more than 30 minutes in purified water at 37°C after storage for 12 months at 30°C.
- the capsule is a soft gelatin capsule comprising a mixture of porcine type A gelatin and a type B gelatin.
- at least 1%, 2%, 3%, 4%, 5%, 10%, 15%, 20%, 25%, 30%, 40% even at least about 50% (w/w) of the gelatin is porcine type A gelatin.
- at least about 55%, 60%, 65%, 70%, 75% (w/w) of the gelatin is porcine type A gelatin.
- at least 80%, 85%, 90%, even 95% (w/w) of the gelatin is porcine type A gelatin.
- the capsule is a soft gelatin capsule in which the gelatin consists essentially of porcine type A gelatin.
- the capsule is a reduced cross-linked gelatin capsule, such as those described in U.S. Pat. No. 7,485,323, incorporated herein by reference in its entirety.
- the capsule comprises succinylated gelatin.
- capsules are made from substances that are not animal by-products, such as agar-agar, carrageenan, pectin, konjak, guar gum, food starch, modified corn .starch, potato starch, and tapioca.
- animal by-products such as agar-agar, carrageenan, pectin, konjak, guar gum, food starch, modified corn .starch, potato starch, and tapioca.
- Non-animal sources of materials that can be used to make capsules useful in the oral unit dosage forms described herein are described in U.S. Patent Publication No. 2011/0117180, incorporated herein by reference.
- Vegicaps ® Capsules (Catalent) are used.
- the capsule is uncoated.
- the capsule is coated.
- the fatty acid composition is released in a time-dependent manner. In various embodiments, there is no substantial release of the PUFA composition for at least 30 minutes after ingestion. In certain embodiments, there is no substantial release of the PUFA composition for at least 30 minutes when release is tested in vitro. In certain embodiments, no more than about 20% of the PUFA composition is released within the first 30 minutes when tested in vitro. In selected embodiments, no more than about 25%, 30%, even no more than about 35% of the PUFA composition is released within the first 30 minutes, when tested in vitro. In particular embodiments, in vitro release properties are assessed according to the procedures described in provisional patent application no. 61/749,124, filed January 4, 2013, titled "Method of release testing for omega-3 polyunsaturated fatty acids," by Bharat Mehta, the disclosure of which is incorporated herein by reference in its entirety.
- substantial quantities of the PUFA composition are released by about 60 minutes after ingestion. In certain embodiments, substantial quantities of the PUFA composition are released by about 60 minutes when tested in vitro. In selected embodiments, at least about 40% of the PUFA composition is released by about 60 minutes, when tested in vitro. In various embodiments, at least about 45%, 50%, 55%, 60%, even at least about 65% of the PUFA composition is released by about 60 minutes, when tested in vitro. In particular embodiments, in vitro release properties are assessed according to the procedures described in provisional patent application no. 61/749,124, filed January 4, 2013, titled "Method of release testing for omega-3 polyunsaturated fatty acids," by Mehta, the disclosure of which is incorporated herein by reference in its entirety.
- capsules are coated as described in U.S. Pat. Nos. 5,792,795 and 5,948,818, the disclosures of which are incorporated herein by reference.
- the coating is a poly(ethylacrylate-methylacrylate) copolymer.
- the coating is Eudragit NE 30-D (Evonik Industries AG), which has an average molecular weight of about 800,000.
- the capsule is coated with an enteric coating that protects the capsule from dissolution or disintegration in the stomach but dissolves at pH values encountered in the small intestine.
- the oral unit dosage form contains from about 100 mg to about 2000 mg of the PUFA composition. In some embodiments, the oral dosage form contains about 250 mg of the PUFA composition. In some embodiments, the oral dosage form contains about 500 mg of the PUFA composition. In certain embodiments, the oral dosage form contains about 750 mg of the PUFA composition. In some embodiments, the oral dosage form contains about 1000 mg of the PUFA composition. In other embodiments, the oral dosage form contains about 1500 mg of the PUFA composition. In certain embodiments, the unit dosage form contains nonintegral weight amounts of PUFA
- composition between 100 mg and 2000 mg.
- a plurality of unit dosage forms as above-described may usefully be packaged together in a dosage kit to increase ease of use and patient compliance.
- the dosage kit is a bottle.
- the plurality of dosage forms is packaged in blister packs, a plurality of which blister packs may optionally be packaged together in a box or other enclosure.
- the plurality of unit dosage forms is sufficient for 30 days, 60 days, or 90 days of dosing.
- the unit dosage form is a capsule containing approximately one gram of pharmaceutical composition as described above, and the dosage kit comprises 30, 60, 90, 120, 150, 180, 240, 270, or 300 such capsules.
- the plurality of unit dosage forms is packaged under an inert gas, such as nitrogen or a noble gas, or is packaged under vacuum. 5.5. Methods of Treatment
- hypertriglyceridemia are provided.
- the methods comprise orally administering the pharmaceutical composition described in Section 5.2 above to a patient having pre-treatment serum or plasma triglyceride levels >500 mg/dL, in an amount and for a duration sufficient to reduce serum or plasma triglyceride levels below pre-treatment levels.
- each dose of the pharmaceutical composition is administered as one or as a plurality of the unit dosage forms described in Section 5.3, above.
- the pharmaceutical composition is administered in an amount and for a duration effective to reduce serum or plasma triglyceride levels by at least about 5%, 6%, 7%, 8%, or at least about 9% below pre-treatment levels. In certain embodiments, the composition is administered in an amount and for a duration effective to reduce serum or plasma triglyceride levels by at least 10%, 11%, 12%, 13%, 14%, 15%, 16%, 17%, 18% or 19% below pre-treatment levels. In particular embodiments, the composition is administered in an amount and for a duration effective to reduce serum or plasma triglyceride levels by at least about 20% below pre-treatment levels. In various embodiments, the pharmaceutical composition is administered in an amount and for a duration effective to reduce serum or plasma triglycerides by at least about 25%, 30%, 35%, 40%, 45%, even at least about 50% below pre-treatment levels.
- the pharmaceutical composition is administered in an amount and for a duration effective to reduce serum or plasma triglyceride levels by at least about 50 mg/dL, 60 mg/dL, 70 mg/dL, 80 mg/dL, 90 mg/dL, even at least about 100 mg/dL. In certain embodiments, the composition is administered in an amount and for a duration effective to reduce serum or plasma triglyceride levels by at least about 110 mg/dL,
- the pharmaceutical composition is administered in an amount and for a duration effective to reduce serum or plasma triglyceride levels by at least about 160 mg/dL, 170 mg/dL, 180 mg/dL, even at least about 190 mg/dL or 200 mg/dL.
- the pharmaceutical composition is administered in an amount and for a duration effective to decrease non-HDL-c levels by at least about 1%, 2%, 3%, 4%, 5%, 6%, 7%, 8%, 9%, even at least about 10% below pre-treatment levels.
- the pharmaceutical composition is administered in an amount and for a duration effective to increase HDL-c levels by at least about 1% above pre- treatment levels. In certain embodiments, the pharmaceutical composition is administered in an amount and for a duration sufficient to increase HDL-c by at least about 2%, 3%, 4%, even at least about 5%, 6%, 7%, 8%, 9%, or 10% above pre-treatment levels.
- the pharmaceutical composition is administered in an amount and for a duration effective to reduce the total cholesterol:HDL-c ("TC/HDL") ratio by at least about 1% below pre-treatment levels. In some embodiments, the pharmaceutical composition is administered in an amount and for a duration sufficient to reduce the TC/HDL ratio by at least about 2%, 3%, 4%, 5%, 6%, 7%, 8%, even at least about 9% or at least about 10% below pre-treatment levels.
- TC/HDL total cholesterol:HDL-c
- the pharmaceutical composition is administered in an amount and for a duration effective to decrease VLDL-c levels by at least about 5%, 6%, 7%, 8%, 9%, or at least about 10% below pre-treatment levels. In certain embodiments, the pharmaceutical composition is administered in an amount and for a duration sufficient to decrease VLDL-c levels by at least about 11%, 12%, 13%, 14%, 15%, 16%, 17%, even at least about 18%, 19%, or 20% below pre-treatment levels. In particular embodiments, the pharmaceutical composition is administered in an amount and for a duration sufficient to decrease VLDL-c levels by at least about 21%, 22%, 23%, 24%, even at least about 25% below pre-treatment levels.
- the pharmaceutical composition is admimstered in an amount and for a duration effective to decrease ApoCIII levels.
- the pharmaceutical composition is administered in an amount and for a duration sufficient to decrease ApoCIII levels by at least about 1%, 2%, 3%, 4%, 5%, 6%, 7%, even at least about 8%, 9% or 10% below pre-treatment levels.
- the pharmaceutical composition is administered in an amount and for a duration effective to increase plasma EPA levels by at least 100% above pre- treatment levels. In certain embodiments, the pharmaceutical composition is administered in an amount and for a duration effective to increase plasma EPA levels by at least about 200%, 250%, 300%, even at least about 350%, 400%, 450% or at least about 500% above pre- treatment levels. In selected embodiments, the pharmaceutical composition is administered for a time and in an amount effective to increase plasma EPA levels by at least about 550%, 600%, 650%, even at least about 700% above pre-treatment levels.
- the pharmaceutical composition is administered in an amount and for a duration effective to increase plasma DHA levels by at least about 50% above pre-treatment levels.
- the pharmaceutical composition is administered in an amount and for a duration effective to increase plasma DHA levels by at least about 55%, 60%, 65%, 70%, even at least about 75%, 80%, 85%, or 90% above pre- treatment levels.
- the pharmaceutical composition is administered in an amount and for a duration effective to increase plasma DPA levels by at least about 50% above pre-treatment levels. In some embodiments, the pharmaceutical composition is administered in an amount and for a duration effective to increase plasma DPA levels by at least about 55%, 60%, 65%, 70%, 75%, even at least about 80%, 85%, 90%, 95%, or 100% above pre-treatment levels. In selected embodiments, the pharmaceutical composition is administered in an amount and for a duration effective to increase plasma DPA levels by at least about 110%, 120%, even at least about 125% above pre-treatment levels.
- the pharmaceutical composition is administered in an amount and for a duration effective to reduce arachidonic acid (AA) concentration in plasma by at least about 5% below pre-treatment levels.
- the pharmaceutical composition is administered in an amount and for a duration effective to reduce arachidonic (AA) concentration in plasma by at least about 6%, 7%, 8%, 9%, 10%, even at least about 11%, 12%, 13%, 14%, even at least about 15%, 16%, 17%, 18%, 19%, 20%, or 21%, 22%, 23%, 24% even at least about 25% below pre-treatment levels.
- the pharmaceutical composition is administered in an amount, and for a duration, effect to reduce plasma arachidonic acid concentration by at least about 25 ⁇ g/mL. In some embodiments, the pharmaceutical composition is administered in an amount and for a duration sufficient to reduce plasma AA levels by at least about
- the effective amount is at least about 2g per day. In various embodiments, the effective amount is at least about 3g per day. In particular embodiments, the effective amount is at least about 4g per day. In typical embodiments, the effective amount is about 2g per day. In certain embodiments, the effective amount is about 4g per day.
- the pharmaceutical composition is administered for at least 30 days. In certain embodiments, the pharmaceutical composition is administered for at least 60 days. In particular embodiments, the pharmaceutical composition is administered for at least 90 days, 120 days, 180 days, 240 days, or at least 360 days. In certain embodiments, the pharmaceutical composition is administered indefinitely.
- the pharmaceutical composition is administered daily. In other embodiments, the pharmaceutical composition is administered every other day.
- the daily dosage of pharmaceutical composition is administered in a single daily dose.
- the pharmaceutical composition is administered in divided doses, with the daily dose divided into two administrations, three administrations, or even four administrations, over the course of the day.
- the pharmaceutical composition is administered with food. In certain embodiments, the pharmaceutical composition is administered with a low fat meal. In other embodiments, the pharmaceutical composition is administered without food. In certain embodiments, the pharmaceutical composition is administered in the fasting state.
- statin is selected from the group consisting of: pravastatin, lovastatin, simvastatin, atorvastatin, fluvastatin, rosuvastatin, tenivastatin, and pitavastatin.
- methods of treating patients who have pre-treatment serum or plasma triglyceride levels of about 200 mg/dL to about 500 mg/dL are provided.
- the patients are already on statin therapy; in these patients, the pre-treatment serum or plasma triglyceride levels are those measured during statin treatment, prior to administration of the pharmaceutical compositions described in Section 5.2 above.
- the method comprises orally administering an effective amount of a statin, and further administering the pharmaceutical composition described in Section 5.2 herein, orally, in an amount and for a duration sufficient to lower serum or plasma triglyceride levels below levels measured prior to treatment with the pharmaceutical composition described herein.
- the pharmaceutical composition described in Section 5.2 and the statin need not be administered at the same time, with the same dosage schedule, or even on the same days. It is sufficient that the two be administered in sufficient temporal proximity that the patient receives therapeutic benefit concurrently from both.
- the pharmaceutical composition described in Section 5.2 is administered in an amount and for a duration sufficient to reduce serum or plasma triglyceride levels by at least about 5% below pre-treatment levels. In various embodiments, the pharmaceutical composition is administered in an amount and for a duration sufficient to reduce serum or plasma triglyceride levels by at least about 6%, 7%, 8%, 9%, 10%, 11%, 12%, 13%, 14%, 15%, even at least about 16%, 17%, 18%, 19%, or at least about 20% below pre-treatment levels.
- the pharmaceutical composition described in Section 5.2 herein is administered in an amount and for a duration sufficient to reduce non-HDL- cholesterol by at least about 1%, at least about 2%, at least about 3%, 4%, 5%, even at least about 7%, 8%, 9%, or at least about 10% below pre-treatment levels.
- the pharmaceutical composition described in Section 5.2 herein is administered in an amount and for a duration sufficient to raise HDL-c levels by at last about 1%, 2%, 3% or more above pre-treatment levels.
- the pharmaceutical composition is administered in an amount and for a duration effective to increase plasma EPA levels by at least 100% above pre- treatment levels. In certain embodiments, the pharmaceutical composition is administered in an amount and for a duration effective to increase plasma EPA levels by at least about 200%, 250%, 300%, even at least about 350%, 400%, 450% or at least about 500% above pre- treatment levels. In selected embodiments, the pharmaceutical composition is administered for a time and in an amount effective to increase plasma EPA levels by at least about 550%, 600%, 650%, even at least about 700% above pre-treatment levels.
- the pharmaceutical composition is administered in an amount and for a duration effective to increase plasma DHA levels by at least about 50% above pre-treatment levels.
- the pharmaceutical composition is administered in an amount and for a duration effective to increase plasma DHA levels by at least about 55%, 60%, 65%, 70%, even at least about 75%, 80%, 85%, or 90% above pre- treatment levels.
- the pharmaceutical composition is administered in an amount and for a duration effective to increase plasma DPA levels by at least about 50% above pre-treatment levels. In some embodiments, the pharmaceutical composition is administered in an amount and for a duration effective to increase plasma DPA levels by at least about 55%, 60%, 65%, 70%, 75%, even at least about 80%, 85%, 90%, 95%, or 100% above pre-treatment levels. In selected embodiments, the pharmaceutical composition is administered in an amount and for a duration effective to increase plasma DPA levels by at least about 110%, 120%, even at least about 125% above pre-treatment levels.
- the pharmaceutical composition is administered in an amount and for a duration effective to reduce arachidonic acid (AA) concentration in plasma by at least about 5% below pre-treatment levels.
- the pharmaceutical composition is administered in an amount and for a duration effective to reduce arachidonic (AA) concentration in plasma by at least about 6%, 7%, 8%, 9%, 10%, even at least about 11%, 12%, 13%, 14%, even at least about 15%, 16%, 17%, 18%, 19%, 20%, or 21%, 22%, 23%, 24% even at least about 25% below pre-treatment levels.
- the pharmaceutical composition is administered in an amount, and for a duration, effect to reduce plasma arachidonic acid concentration by at least about 25 ⁇ g/mL. In some embodiments, the pharmaceutical composition is administered in an amount and for a duration sufficient to reduce plasma AA levels by at least about
- the pharmaceutical composition described in Section 5.2 herein is administered in unit dosage forms as described in Section 5.3 above.
- the pharmaceutical composition is administered in an amount of at least about lg per day. In some embodiments, the pharmaceutical composition is administered in an amount of at least about 2g/day. In certain embodiments, the pharmaceutical composition is administered in an amount of at least about 3g/day. In particular embodiments, the pharmaceutical composition is administered in an amount of at least about 4g/day. In typical embodiments, the pharmaceutical composition is administered in an amount of about 2g/day. In certain embodiments, the pharmaceutical composition is administered in an amount of about 3g/day or about 4g per day.
- Methods are also provided for increasing the EPA: AA ratio, without regard to the patient's pre-treatment plasma triglyceride levels.
- the methods comprise administering the pharmaceutical composition described in Section 5.2 herein to a patient having an EPA:AA ratio below about 0.25, in an amount and for duration sufficient to increase the patient's EPA:AA ratio to at least about 0.25.
- the pharmaceutical composition is administered in an amount and for a duration sufficient to increase the patient's EPA:AA ratio to at least about 0.3, at least about 0.35, at least about 0.40, at least about 0.45, at least about 0.50, even to a level of at least about 0.55, 0.60, 0.61, 0.62, 0.63, 0.64, or 0.65.
- the method comprises administering the pharmaceutical composition in an amount and for a duration effective to increase plasma EPA levels by at least 100% above pre-treatment levels.
- the pharmaceutical composition is administered in an amount and for a duration effective to increase plasma EPA levels by at least about 200%, 250%, 300%, even at least about 350%, 400%, 450% or at least about 500% above pre-treatment levels.
- the pharmaceutical composition is administered for a time and in an amount effective to increase plasma EPA levels by at least about 550%, 600%, 650%, even at least about 700% above pre-treatment levels.
- the pharmaceutical composition is administered in an amount and for a duration effective to increase plasma DHA levels by at least about 50% above pre-treatment levels.
- the pharmaceutical composition is administered in an amount and for a duration effective to increase plasma DHA levels by at least about 55%, 60%, 65%, 70%, even at least about 75%, 80%, 85%, or 90% above pre- treatment levels.
- the pharmaceutical composition is administered in an amount and for a duration effective to increase plasma DP A levels by at least about 50% above pre-treatment levels. In some embodiments, the pharmaceutical composition is administered in an amount and for a duration effective to increase plasma DPA levels by at least about 55%, 60%, 65%, 70%, 75%, even at least about 80%, 85%, 90%, 95%, or 100% above pre-treatment levels. In selected embodiments, the pharmaceutical composition is administered in an amount and for a duration effective to increase plasma DPA levels by at least about 110%, 120%, even at least about 125%» above pre-treatment levels.
- the pharmaceutical composition is administered in an amount and for a duration effective to reduce arachidonic acid (AA) concentration in plasma by at least about 5% below pre-treatment levels.
- the pharmaceutical composition is administered in an amount and for a duration effective to reduce arachidonic (AA) concentration in plasma by at least about 6%, 7%, 8%, 9%, 10%, even at least about 11%, 12%, 13%, 14%, even at least about 15%, 16%, 17%, 18%, 19%, 20%, or 21%, 22%, 23%, 24% even at least about 25% below pre-treatment levels.
- the pharmaceutical composition is administered in an amount, and for a duration, effect to reduce plasma arachidonic acid concentration by at least about 25 ⁇ g/mL. In some embodiments, the pharmaceutical composition is administered in an amount and for a duration sufficient to reduce plasma AA levels by at least about
- the pharmaceutical composition described in Section 5.2 herein is administered in unit dosage forms as described in Section 5.3 above.
- the pharmaceutical composition is administered in an amount of at least about lg per day. In some embodiments, the pharmaceutical composition is administered in an amount of at least about 2g/day. In certain embodiments, the pharmaceutical composition is administered in an amount of at least about 3g/day. In particular embodiments, the pharmaceutical composition is administered in an amount of at least about 4g/day. In typical embodiments, the pharmaceutical composition is administered in an amount of about 2g/day. In certain embodiments, the pharmaceutical composition is administered in an amount of about 3g/day or about 4g per day.
- Methods are also provided for increasing a patient's serum or plasma ApoCIII levels, without regard to the patient's pre-treatment plasma triglyceride levels.
- the methods comprise administering the pharmaceutical composition described in Section 5.2 herein to a patient in need of lower ApoCIII levels, in an amount and for duration sufficient to decrease the patient's serum or plasma ApoCIII levels.
- the patient is at risk for cardiovascular heart disease.
- the pharmaceutical composition is administered in an amount and for a duration sufficient to decrease ApoCIII levels by at least about 1%, 2%, 3%, 4%, 5%, 6%, 7%, even at least about 8%, 9% or 10% below pre-treatment levels.
- compositions described herein is used to treat other disorders, including one or more of nonalcoholic steatohepatitis (NASH),
- NASH nonalcoholic steatohepatitis
- hyperlipoproteinemia including type III hyperlipoproteinemia, and metabolic syndrome.
- the pharmaceutical composition is used to reduce resistance to platelet aggregation inhibitors, such as Plavix, including use in the methods described in U.S. Patent Application No. 13/620,312 , the disclosure of which is incorporated herein by reference in its entirety.
- an improved process is presented for refining fish oil into pharmaceutical compositions comprising PUFAs in free acid form, and particularly for refining fish oil into the pharmaceutical compositions described in Section 5.2 herein.
- the intermediate feedstock is prepared by transesterification of the body oil obtained from fish, for example fish from families Engraulidae, Clupeidae and Scombridae, by standard techniques well-known in the art, with process parameters adjusted so as to achieve a composition falling within the tolerances described in section 5.6.2 immediately below.
- a crude triglyceride oil is extracted from fish, such as anchovy, sardine, mackerel and menhaden.
- the crude triglyceride oil is then alkali refined, e.g. using sodium hydroxide, and deodorized, polished, and dried.
- the PUFAs are then converted to esters, such as methyl esters or ethyl esters, by transesterification.
- Transesterification can be performed, for example, by ethanolysis in the presence of ethanol and sodium ethoxide to produce ethyl esters. Transesterification is followed by at least one round, typically a plurality of rounds, of distillation.
- triglyceride oil is alkali refined and deodorized, transesterified with ethanol, such as by ethanolysis in the presence of ethanol and sodium ethoxide, and then subject to one or more rounds of fractional distillation.
- FIG. 2 presents a flow chart of an exemplary process for producing the intermediate feedstock.
- fish are cooked in water and the resulting mixture of liquids and solids are filtered and the liquid portion centrifuged to remove the aqueous phase.
- the oily fraction remaining from the preceding step is treated with alkali to neutralize any free fatty acids present, followed by water washing.
- alkali refined fish oil in the triglyceride form is deodorized and environmental pollutants reduced, e.g. by distillation.
- the dried deodorized fish oil is converted to the ethyl ester form using reaction with ethanol, catalyzed by the use of sodium ethoxide.
- the excess ethanol is removed by distillation and the ethyl esters washed with a citric acid solution and then with water.
- the ethyl esters are distilled to achieve the required concentration of EPA ethyl ester (EPA-EE) and DHA ethyl ester (DHA-EE) for use as an intermediate feedstock.
- EPA-EE EPA ethyl ester
- DHA-EE DHA ethyl ester
- multiple rounds of distillation are performed. The exact conditions used are adjusted depending on the composition of the input ethyl ester composition in order to achieve the required concentration of EPA-EE and DHA-EE for the intermediate feedstock, as detailed in section 5.6.2 immediately below.
- the intermediate feedstock composition comprises a plurality of species of omega-3 PUFAs, each present substantially in the form of an ethyl ester.
- the intermediate feedstock composition comprises EPA, DHA, and DP A, each substantially in the form of an ethyl ester.
- the intermediate feedstock composition comprises EPA ethyl ester (EPA-EE), DHA-EE, and DPA-EE, in an amount, calculated as a percentage by area on GC chromatogram of all fatty acid ethyl esters in the composition, falling within the range of -3SD to +3 SD of the averages respectively recited in Table 9.
- each of EPA-EE, DHA-EE, and DPA-EE falls within -2SD to +2 SD of the respectively recited average.
- each of EPA-EE, DHA-EE, and DPA- EE falls with - ISD to +1SD of the respectively recited average.
- the intermediate feedstock composition comprises EPA-EE, DHA-EE, and DPA-EE within the range set by their respective minima and maxima area percentages among the batches described in Table 8.
- the composition further comprises one or more omega-3 polyunsaturated fatty acids, each substantially in the form of the ethyl ester, selected from the group consisting of: a-linolenic acid (CI 8:3 n-3), moroctic acid (CI 8:4 n-3), eicosatrienoic acid (C20:3 n-3), eicosatetraenoic acid (C20:4 n-3), and heneicosapentaenoic acid (C21:5 n-3).
- omega-3 polyunsaturated fatty acids each substantially in the form of the ethyl ester, selected from the group consisting of: a-linolenic acid (CI 8:3 n-3), moroctic acid (CI 8:4 n-3), eicosatrienoic acid (C20:3 n-3), eicosatetraenoic acid (C20:4 n-3), and heneicosapentaenoic acid (C21:5
- the one or more further species of omega-3-EE if present, is present in an amount, calculated as a percentage by area on GC chromatogram of all fatty acid ethyl esters in the composition, falling within the range of -3SD to +3 SD of the averages respectively recited in Table 9.
- each species falls within -2SD to +2 SD of the respectively recited average.
- each species falls with - ISD to + ISD of the respectively recited average.
- the one or more further species of omega-3-EE if present, is present in an amount, calculated as a percentage by area on GC chromatogram of all fatty acid ethyl esters in the composition, falling within the range set by their respective minima and maxima area percentages among the batches described in Table 8.
- the intermediate feedstock composition also comprises at least one species of omega-6 PUFA.
- the composition comprises ethyl esters of one or more omega-6 polyunsaturated fatty acid selected from the group consisting of: linoleic acid (C18:2 n-6), gamma-linolenic acid (C18:3 n-6), eicosadienoic acid (C20:3 n-6), dihomo-gamma-linolenic acid (“DGLA”) (C20:3 n-6), arachidonic acid (C20:4 n-6) ("AA”), and docosapentaenoic acid (C22:5 n-6).
- omega-6 PUFA is present substantially in ethyl ester form.
- the one or more species of omega-6-EE if present, is present in an amount, calculated as a percentage by area on GC chromatogram of all fatty acid ethyl esters in the composition, falling within the range of -3SD to +3 SD of the averages respectively recited in Table 9.
- each species falls within -2SD to +2 SD of the respectively recited average.
- each species falls with -ISD to +1SD of the respectively recited average.
- the one or more further species of omega-3-EE if present, is present in an amount, calculated as a percentage by area on GC chromatogram of all fatty acid ethyl esters in the composition, falling within the range set by their respective minima and maxima area percentages among the batches described in Table 8.
- the intermediate feedstock composition comprises EPA ethyl ester (EPA-EE) in an amount, calculated as a percentage by area on GC chromatogram of all fatty acid ethyl esters in the composition, of about 45.0 - about 53.0% (a/a). In certain embodiments, EPA-EE is present in an amount of about 48.40 - about 50.04% (a/a). In various embodiments, EPA-EE is present in an amount of about 48.67 - about 49.77% (a/a). In some embodiments, the intermediate feedstock composition comprises EPA-EE in an amount of about 48.95 - about 49.49% (a/a). In certain
- the intermediate feedstock composition comprises EPA-EE in an amount of about 49.22% (a/a).
- EPA-EE is present in an amount of about 44.20% (a/a) - about 46.92% (a/a). In some embodiments, EPA-EE is present in an amount of about 45.56% (a/a).
- EPA-EE is present in an amount of about 425 - 460 mg/g.
- the intermediate feedstock composition comprises DHA ethyl ester (DHA-EE) in an amount, calculated as a percentage by area on GC chromatogram of all fatty acid ethyl esters in the composition, of about 13.0 - about 20.0% (a/a). In various embodiments, DHA-EE is present in an amount of about 16.43 - about 18.28% (a/a). In various embodiments, the feedstock comprises DHA-EE in an amount of about 16.74 - about 17.98% (a/a). In some embodiments, the intermediate feedstock composition comprises DHA-EE in an amount of about 17.05 % - about 17.67% (a/a). In certain embodiments, the intermediate feedstock comprises DHA-EE in about 17.4%» (a/a).
- DHA-EE DHA ethyl ester
- the intermediate feedstock comprises DHA in an amount of about 14.77% (a/a) - about 17.87% (a/a). In some embodiments, the intermediate feedstock comprises DHA in an amount of about 16.32% (a/a).
- the intermediate feedstock comprises DHA in an amount of 150 - 170 mg/g.
- DPA-EE is present in an amount of about 4.10 to about 6.74 % (a/a). In some embodiments, DPA-EE is present in an amount of about 4.54 to about 6.30% (a/a). In various embodiments, DPA-EE is present in an amount of about 4.98 to about 5.86% (a/a). In certain embodiments, DPA-EE is present in an amount of about 5.42% (a/a).
- DPA-EE is present in an amount of about 0.41 to about 0.70% (a/a). In certain embodiments, DPA-EE is present in an amount of about 0.56% (a/a).
- the intermediate feedstock composition further comprises the ethyl ester of arachidonic acid (C20:4 n-6).
- AA-EE is present in an amount of about 1.72 to about 2.81% (a/a).
- arachidonic acid-EE is present in an amount of about 1.9 to about 2.63% (a/a).
- arachidonic acid-EE is present in an amount of about 2.09 to about 2.45% (a a).
- arachidonic acid-EE is present in an amount of about 2.27% (a/a).
- arachidonic acid-EE is present in an amount of no more than 3.0% (a/a). In some embodiments, arachidonic acid-EE is present in an amount of no more than 4.0% (a/a).
- a-linolenic acid-EE is, in certain embodiments, present in an amount of about 0.3 - about 0.45% (a/a). In some embodiments, ⁇ -linolenic acid-EE is present in an amount of about 0.4% (a/a).
- ⁇ -linolenic acid-EE is present in an amount of about 0.24% (a/a) - 0.62% (a/a).
- ⁇ -linolenic acid-EE is present in an amount of about 0.43% (a/a).
- moroctic acid-EE is present in an amount, calculated as a percentage by area on GC chromatogram of all fatty acid ethyl esters in the composition, of about 0.60 - about 2.03% (a/a). In some embodiments, moroctic acid-EE is present in an amount of about 0.84 to about 1.80%) (a/a). In various embodiments, moroctic acid-EE is present in an amount of about 1.10 to about 1.60% (a/a). In particular embodiments, moroctic acid-EE is present in an amount of about 1.32 % (a/a).
- moroctic acid-EE is present in an amount of about 0.64% to about 1.93% (a/a). In particular embodiments, moroctic acid-EE is present in an amount of about 1.28 % (a/a).
- eicosatrienoic acid-EE is present in an amount of less than about 0.1% (a/a). In some embodiments, eicosatrienoic acid-EE is present in an amount of less than about 0.4% (a/a).
- eicosatetraenoic acid-EE is, in certain embodiments, present in an amount of about 1.57 to about 2.10% (a/a). In some embodiments, eicosatetraenoic acid- EE is present in an amount of about 1.66 to about 2.02% (a/a). In certain embodiments, eicosatetraenoic acid-EE is present in an amount of about 1.75 to about 1.93% (a/a). In specific embodiments, eicosatetraenoic acid-EE is present in an amount of about 1.84% (a/a).
- eicosatetraenoic acid-EE is present in an amount of about 1.42 to about 2.49% (a/a). In some embodiments, eicosatetraenoic acid-EE is present in an amount of about 1.95% (a/a).
- the heneicosapentaenoic acid-EE is present in an amount of about 2.25 to about 2.36% (a/a). In various embodiments, the
- heneicosapentaenoic acid-EE is present in an amount of about 2.27 - about 2.34% (a/a). In some embodiments, the heneicosapentaenoic acid-EE is present in an amount of about 2.29 to about 2.32 % (a/a). In particular embodiments, the heneicosapentaenoic acid-EE is present in an amount of about 2.31% (a/a).
- the heneicosapentaenoic acid-EE is present in an amount of about 1.42 to about 2.76 % (a/a). In particular embodiments, the heneicosapentaenoic acid- EE is present in an amount of about 2.09% (a/a).
- linoleic acid-EE is present in an amount of about 0.53 to about 0.56% (a/a). In some embodiments, linoleic acid-EE is present in an amount of about 0.53 to about 0.55% (a/a). In some embodiments, linoleic acid-EE is present in an amount of about 0.54 to about 0.55% (a/a). In certain embodiments, linoleic acid-EE is present in an amount of about 0.54% (a/a).
- linoleic acid-EE is present in an amount of about 0.38 to about 0.83% (a/a). In certain embodiments, linoleic acid-EE is present in an amount of about 0.60% (a/a).
- gamma-linolenic. acid-EE is present, in exemplary embodiments, in an amount less than 0.1% (a/a). In embodiments of the intermediate feedstock that further comprise the ethyl ester of gamma-linolenic acid (CI 8:3 n-6), gamma- linolenic acid-EE is present in an amount less than 0.4% (a/a).
- eicosadienoic acid-EE is present in an amount of about 0.00 to about 0.63% (a/a) in various exemplary embodiments. In some embodiments, eicosadienoic acid-EE is present in an amount of about 0.00 to about 0.45% (a/a). In certain embodiments, eicosadienoic acid-EE is present in an amount of about 0.00 to about 0.27% (a/a). In particular embodiments, eicosadienoic acid-EE is present in an amount of about 0.09% (a/a).
- eicosadienoic acid-EE is present in an amount of about 0.00 to about 0.54% (a/a). In particular embodiments, eicosadienoic acid-EE is present in an amount of about 0.25% (a/a).
- DGLA-EE is present in an amount of about 0.35 to about 0.68% (a/a). In some embodiments, dihomo-gamma-linolenic acid-EE is present in an amount of about 0.41 to about 0.63% (a/a). In some embodiments, dihomo- gamma-linolenic acid-EE is present in an amount of about 0.46 to about 0.57% (a/a).
- dihomo-gamma-linolenic acid-EE is present in an amount of about 0.26 to about 0.55% (a/a). In some embodiments, dihomo-gamma-linolenic acid-EE is present in an amount of about 0.40% (a/a).
- docosapentaenoic acid C22:5 n-6
- docosapentaenoic acid-EE is present in an amount of about 0.54 to about 0.80% (a/a).
- docosapentaenoic acid-EE is present in an amount of about 0.59% to about 0.76% (a/a).
- docosapentaenoic acid-EE is present in an amount of about 0.63% to about 0.72% (a/a).
- docosapentaenoic acid-EE is present in an amount of about 0.67% (a/a).
- docosapentaenoic acid (C22:5 n-6)-EE is present in an amount of about 1.45% to about 7.21% (a/a). In some embodiments, docosapentaenoic acid (C22:5 n-6)-EE is present in an amount of about 4.33% (a/a).
- Intermediate transesterified feedstock having a composition as above-defined is subjected to urea inclusion complexation.
- the amount of urea used for complexation falls within an algorithmically-determined range.
- an improved process for refining fish oil into pharmaceutical compositions comprising PUFAs in free acid form, particularly for refining fish oil into the pharmaceutical compositions described herein.
- the improvement comprises subjecting an intermediate feedstock of transesterified fish oil comprising the ethyl esters of various omega-3 and omega-6 PUFA species in defined percentage ranges to a step of urea inclusion complexation, wherein the amount of urea used for complexation is within the range calculated according to (i) formula 1(a), or (ii) according to formula 1(b), or
- [Urea] F en richment-EPA * ((EPA ta rget - EPA-EEj n p U t)/EPA-EEi n put)) (lb).
- the DHA and EPA target values are selected based on the desired final composition.
- the enrichment factors, F e nrichment-DHA and F enr j C h me nt-EPA 5 can be the same or different.
- F en richment-DHA and F en richment-EPA are the same, with a value of about 100/0.34, or about 300.
- complexation is performed according to standard techniques. See, e.g., U.S. Pat. Nos.
- the intermediate feedstock is mixed with a solution of urea in ethanol.
- the complexation is carried out at 60°C - 80°C, the mixture is then cooled, and the mixture is thereafter filtered or centrifuged to remove urea complexes. Ethanol is removed by distillation and the oil washed several times with water.
- the uncomplexed PUFA esters are hydrolyzed to free fatty acids by standard techniques.
- the composition is further purified by distillation, either before or after hydrolysis, and further finished using one or more of the following standard techniques: treatment with active carbon, chromatographic purification, solvent removal, bleaching, e.g. with bleaching earth, and supercritical extraction.
- Antioxidants such as BHA or a-tocopherol, are added.
- Urea inclusion complexation is a standard step often used in the refining of fish oils to remove saturated and mono-unsaturated long chain fatty acids, thus enriching for desired long chain omega-3 polyunsaturated fatty acids in the resulting composition.
- [Urea] F enr ichment-DHA * ((DHAtarget - DHA-EEi n p Ut )/DHA-EE in p U t)) (la)
- [Urea] F e perennialrichment-EPA * ((EPAtarget - EPA-EEinpu /EPA-EEinput)) (lb).
- the enrichment factors, F en richment-DHA and F en richment-EPA> can be the same or different.
- a typical value, using the intermediate feedstock batches described in Examples 2 and 4, has been found to be about 100/0.34 (i.e., about 300) for both.
- DHA docosahexaenoic acid 22:6 n-3 17.09 19.65
- the urea complexation step substantially decreased the percentage of saturated fatty acids and mono-unsaturated fatty acids in the resulting composition, thereby substantially enriching for polyunsaturated fatty acids. See Tables 3 - 6, and FIG. 3 A.
- Table 7 provides a qualitative assessment of enrichment of various species of polyunsaturated fatty acid, comparing prevalence in the ethyl ester intermediate feedstock to that in the free acid API, averaged across the four production batches described in
- omega-3 polyunsaturated fatty acids are substantially enriched, the effect of urea complexation on omega-6 PUFAs, as a class, is not as predictable.
- the omega-6 species DGLA and docosapentaenoic acid are reduced in prevalence; gamma-linolenic acid and arachidonic acid are increased; and there is little or no effect on linolenic acid and eicosadienoic acid.
- omega-3 docosapentaenoic acid species DPA (C22:5 n-3)
- DPA docosapentaenoic acid
- C22:5 n-6 docosapentaenoic acid
- omega-3 docosapentaenoic acid species DPA
- DPA omega-3 docosapentaenoic acid species
- DPA is the third most prevalent species of polyunsaturated fatty acid in the API, exceeded only by EPA and DHA. At this level, the DPA concentration is also 10-fold greater than that reported for an earlier pharmaceutical composition of omega-3 polyunsaturated fatty acids in free acid form, termed Purepa, in which DPA was reported to be present at a level of 0.5%. See Belluzzi et al, Dig. Dis. Sci. 39(12): 2589-2594 (1994).
- Tables 3-6 in Example 2, produced from eight (8) different batches of intermediate transesterified (ethyl ester) feedstock, are presented in the tables below.
- the composition of each of the intermediate feedstock batches is shown in Table 8.
- Table 9 presents the average ("AVG"), standard deviation ("STDEV”, "SD”), and Delta (" ⁇ ", the absolute difference between +1 SD and -1 SD, +2 SD and -2 SD, etc.) across the 8 batches of intermediate feedstock for each of the listed (ethyl ester) species.
- the composition of each of the ten batches of final API is shown in Table 10, below; Table 11 presents the average, standard deviation, and Delta values for each of the listed (free acid) species across the 10 batches of API.
- DPA is the third most prevalent species of polyunsaturated fatty acid in the pharmaceutical compositions analyzed in the examples above, and is present at a
- DPA is an intermediate in the biosynthetic pathway from EPA to DHA (see FIG. 1), surprisingly little is known about the
- DPA DPA's specific biological effects. See Kaur et ah, "Docosapentaenoic acid (22:5n-3): a review of its biological effects," Prog. Lipid Res. 50:28-34 (2011). To clarify the potential contribution of DPA to clinical efficacy of the pharmaceutical composition, gene expression profiling experiments were conducted.
- DMEM Dulbecco's Modified Eagle's Medium
- BSA bovine serum albumin
- Ratios of EPA (at 100 ⁇ ), DHA (at 40 ⁇ ), and DPA (at 11 ⁇ ) were chosen to approximate the ratios of EPA, DHA, and DPA in the pharmaceutical compositions (API) described in Section 5.2 and Example 5 (see Tables 12 and 13). Absolute concentrations were chosen to best approximate - within the constraint imposed by the desired
- compositional ratios and constraints imposed by the culture conditions - the plasma ranges observed in the 2g and 4g treatment arms of the EVOLVE trial (see Example 10).
- the lower DPA concentration (1 ⁇ ) was chosen to approximate the systemic exposure that would be expected from use of the earlier pharmaceutical composition of omega-3 polyunsaturated fatty acids in free acid form, termed Purepa, in which DPA was reported to be present at a level 1/10 that seen in the current pharmaceutical composition.
- HepG2 cells were incubated with the identified fatty acid (EPA, DHA, DPA, or specified mixtures) for a total of 48 hours prior to cell harvest and R A extraction.
- the identified fatty acid EPA, DHA, DPA, or specified mixtures
- DPA is an intermediate in the biosynthetic pathway from EPA to DHA, and although DPA is known to retroconvert to EPA in vivo, Kaur et ah, Prog. Lipid Res. 50:28-
- RGS2 (includes EG:19735) t
- MST1 (includes EG: 15235) t t
- the lower DPA concentration (1 ⁇ ) was chosen to approximate the systemic exposure that would be expected from use of the earlier pharmaceutical composition of omega-3 polyunsaturated fatty acids in free acid form, termed Purepa, in which DPA was reported to be present at a level 1/10 that seen in the current pharmaceutical composition.
- the threshold dose effect can also be seen by focusing on three categories of genes known to be relevant to the clinical effects of omega-3 polyunsaturated fatty acids: genes involved in lipid metabolism, genes involved in cardiovascular physiology, and genes involved in inflammation (assignment of genes to the identified categories performed automatically by the iReportTM software). Results are tabulated in Table 24, below. Table 24
- the 11 ⁇ in vitro concentration is lower than the ⁇ 90 ⁇ plasma concentration observed in the 4g/day EVOLVE patients. See Example 10. The results thus predict that a clinically-relevant dose of the DPA-enriched compositions described in Section 5.2 and Example 5 (see Table 12 and 13) will have significant metabolic effects, including effects on lipid metabolism, cardiovascular physiology, and inflammation. Few, if any, of these DPA- specific effects would be expected at the 10-fold lower DPA levels seen in the earlier Purepa preparation.
- DPA at 11 ⁇ upregulates ACADSB, the short/branched chain acyl- CoA dehydrogenase.
- the ACADSB gene product is involved in breakdown of triglycerides; upregulation would be expected to result in lower serum triglyceride levels.
- HMGCR which is downregulated, encodes HMG-CoA reductase, the rate-limiting enzyme for cholesterol synthesis and the target for statin inhibition.
- statin action downregulation of expression of the HMGCR gene by DPA should lead to favorable decreases in the total cholesterol:HDL ratio.
- SQLE which is also downregulated, encodes squalene epoxidase, which catalyzes the first oxygenation step in sterol biosynthesis and is thought to be one of the rate-limiting enzymes in this pathway. Downregulation of SQLE should also lead to reduced total cholesterol 16vels.
- DPA affects expression of genes in multiple metabolic pathways, including genes in categories known to be relevant to the clinical effects of omega-3 polyunsaturated fatty acids: genes involved in lipid metabolism, genes involved in cardiovascular physiology, and genes involved in inflammation. Significant second-order effects are expected, given the changes we observed in the expression of genes that encode proteins that themselves affect gene expression, and in genes encoding proteins that affect post-transcriptional modification.
- DPA DPA-driven upregulation of ACADSB, the short branched chain acyl-CoA dehydrogenase, expected to result in lower serum triglyceride levels; downregulation of HMGCR, which, like treatment with statins, should lead to favorable decreases in the total cholesterol :HDL ratio; and downregulation in ' SQLE, which should analogously lead to reduced total cholesterol levels.
- Lovaza ® - Prescription Lovaza ® capsules were acquired through commercial US sources. According to the FDA-approved product label, each 1-gram capsule of Lovaza ® contains at least 900 mg of the ethyl esters of omega-3 fatty acids sourced from fish oils, predominantly a combination of ethyl esters of eicosapentaenoic acid (EPA - approximately 465 mg) and docosahexaenoic acid (DHA - approximately 375 mg). Independent compositional analysis was not performed.
- STUDY DRUG (Epanova ® ) - Type A porcine soft gelatin capsules coated with Eudragit NE 30-D (Evonik Industries AG) were prepared, each containing one gram of a PUFA composition in which the polyunsaturated fatty acids are present in the form of free fatty acids ("API").
- the encapsulated API had the composition set forth in Table 26.
- FIG. 4 provides a treatment flow diagram illustrating the design of the study: briefly, after a washout period, subjects were randomized to one of two treatment sequences: (i) Epanova (low fat) ⁇ Lovaza (low-fat) ⁇ Epanova (high-fat) ⁇ Lovaza (high fat), or
- Low-fat period meals (periods 1 and 2): no breakfast (fasting); no-fat lunch (0 g fat; 600 kcal) after the 4-hour blood draw; low-fat dinner (9 g fat; 900 kcal) after the 12-hour blood draw.
- Low-fat food items were: fat-free yogurt, fruit cup, fat-free Fig Newtons, Lean Cuisine meal.
- High-fat period meals (periods 3 and 4): high-fat breakfast (20 g fat; 600 kcal) immediately after the 0.5 hour blood draw; high-fat lunch (30 g fat; 900 kcal) after the 4-hour blood draw; and high-fat dinner (30 g fat; 900 kcal) after the 12-hour blood draw.
- High-fat food items were: breakfast sandwich & powdered mini-donuts; cheese pizza; potato chips; and cheese and ham panini.
- Pre-trial screening washout requirements were: 60 days for fish oil, EPA or DHA supplements or fortified foods; 7 days for fish, flaxseed, perilla seed, hemp, spirulina, or black currant oils, statins, bile acid sequestrants, cholesterol absorption inhibitors or fibrates.
- the crossover washout period was at least 7 days.
- Ratios of means were calculated using the least square means for ln-transformed AUCo-b AUCo-inf, and C max .
- the ratios of means and their 90% confidence intervals are to lie above the upper limit of 125.00% for AUC 0-t , AUC 0- i nf and C max in order to show Epanova ® has superior relative bioavailability compared to Lovaza ® with regards to diet.
- Study population The study enrolled 54 healthy adults, 41 males (75.9%) and 13 females (24.1%), aged 21 to 77. All of the treatment periods were completed by 51 subjects (94.4%), with 53 subjects (98.1%) completing the low fat portion of the study. The population was predominantly Black or African- American (66.7%) with 31.5% White and 1.8% Asian.
- Bioavailability - FIG. 5 compares the bioavailability of total EPA+DHA (baseline- adjusted change) following a single dose (4g) of Lovaza ® during the high-fat and low-fat periods (fasted dose conditions), confirming that the bioavailability of Lovaza ® is significantly decreased with the low-fat diet.
- the baseline-adjusted change in total plasma EPA+DHA levels show that the AUC t for Lovaza ® in the low-fat meal period is decreased by 83.3% compared to Lovaza ® in the high-fat meal period: 661.6 vs 3959.5 nmol-h/mL, respectively (p ⁇ 0.0001) (LS mean data in Table 27, below).
- N 53 a p-value is for the Least Square (LS) Mean Difference between Epanova ® and Lovaza ® from the ANOVA model
- FIG. 6 compares the bioavailability of total EPA+DHA (baseline-adjusted change) during the high-fat period following a single dose (4g) of Lovaza ® versus a single dose (4g) of Epanova ® , demonstrating that in the high-fat meal periods, in which the bioavailability of Lovaza ® was confirmed to be greatest, the bioavailability EPA + DHA was nonetheless significantly greater when administered in free fatty acid form (Epanova ® ) than as the corresponding ethyl ester omega-3 composition (Lovaza ® ) (p ⁇ 0.0007).
- FIG. 7 compares the bioavailability of total EPA+DHA (baseline-adjusted change) following a single dose of Epanova ® vs. Lovaza ® during the low-fat diet period,
- N 53 a p-value is for the Least Square (LS) Mean Difference between Epanova and Lovaza from the ANOVA model b covariance %
- FIG. 8 compares the bioavailability of EPA (baseline-adjusted change) following a single dose of Epanova ® vs. Lovaza ® during the low-fat diet period, showing a 13.5-fold greater AUC t for Epanova ® than Lovaza ® during low-fat meal periods: 578.2 vs. 42.7 ⁇ g ⁇ h/mL, respectively (pO.0001) (LS mean data are presented in Table 29, below).
- FIG. 9 compares the bioavailability of DHA (baseline-adjusted change) following a single dose of Epanova ® vs. Lovaza ® during the low-fat diet period, showing a 2.2-fold greater AUC t for Epanova ® than Lovaza ® during low-fat meal periods: 383.1 vs 173.4 ⁇ g ⁇ hr/mL, respectively (pO.0001) (LS mean data presented in Table 30, below).
- the 2.2-fold greater DHA bioavailability in Epanova ® vs Lovaza ® occurred despite there being 42% less DHA in the Epanova ® formulation.
- N 53 p-value is for the Least Square (LS) Mean Difference between Epanova and Lovaza from the ANOVA model covariance %
- FIGS. 10A and 10B present individual subject AUC 0-t responses during the low-fat and high diets expressed as the ratio (%) of low-fat AUC 0-t to high-fat AUC 0-t . Negative ratios were not plotted. The data show that during the low-fat diet period, 30 of 54 (56%) subjects on Epanova ® (free fatty acids) versus 3 of 52 (6%) on Lovaza ® (ethyl esters) maintained an AUQ that was >50% of the respective high-fat diet period AUQ.
- FIG. 11 is a treatment flow diagram illustrating the design of the 14 day comparative bioavailability trial, in which study drug (Lovaza ® or Epanova ® ) was consumed with a low fat breakfast. In contrast, doses were given fasting in the low fat arm of the original ECLIPSE trial described in Example 7.
- study drug Liza ® or Epanova ®
- Changes from baseline to steady state in EPA and DHA levels in the Lovaza arm of the 14 day comparative bioavailability were consistent with prior studies, as shown in Table 31, which presents the mean percentage change in EPA and DHA in the identified prior studies.
- FIG. 12A plots the mean un-adjusted total EPA+DHA concentrations versus time (linear scale), both for treatment with Lovaza ® and treatment with Epanova ® .
- FIG. 12B is a histogram showing the difference in unadjusted EPA+DHA (nmol/mL) for the time points bracketed in FIG. 12A.
- FIGS. 12A and 12B demonstrate that after 14-days of dosing, accumulation of EPA+DHA from Epanova ® was 2.6 fold higher than Lovaza ® in subjects maintained on a low-fat diet.
- FIG. 13 plots mean baseline-adjusted plasma total EPA+DHA concentrations versus time (linear scale) for treatment with Lovaza ® vs. treatment with Epanova ® in the 14 day comparative bioavailability study, demonstrating that after 14-days of dosing with a low-fat meal, EPA+DHA levels (AUCo -24 ) from Epanova were 5.8 fold higher than Lovaza in subjects maintained on a low-fat diet.
- FIG. 14A is a histogram that plots the increases from baseline to steady state in unadjusted blood levels for EPA+DHA in the Lovaza ® and Epanova ® arms of the 14 day comparative bioavailability study, demonstrating that blood levels of EPA+DHA increased 316% from baseline to steady-state in the Epanova ® cohort compared to 66% in the Lovaza ® cohort.
- FIG. 14B is a histogram that plots the increases from baseline to steady state in unadjusted C aV g for EPA+DHA in the Lovaza ® and Epanova ® arms of the 14 day
- FIG. 15 A is a histogram that plots the increases from baseline to steady state for total blood levels of DHA in the Lovaza ® and Epanova ® arms of the 14 day comparative bioavailability study, demonstrating that levels of DHA increased 109% from baseline to steady-state in the Epanova ® cohort compared to 34% in the Lovaza ® cohort.
- FIG 15B plots the increases from baseline to steady state for DHA C avg levels in the Epanova ® cohort compared to Lovaza ® cohort in the 14 day comparative bioavailability study, and
- FIG. 16A is a histogram that plots the increases from baseline to steady state for total EPA levels in blood in the Lovaza ® and Epanova ® arms of the 14 day comparative bioavailability study, and demonstrates that Levels of EPA increased 1021% from baseline to steady-state in the Epanova ® cohort compared to 210% in the Lovaza ® cohort.
- FIG. 16B plots the average concentration increases from baseline to steady-state, and demonstrates that Cavg levels of EPA increased 1,465% from baseline in the Epanova ® cohort compared to 297% in the Lovaza ® cohort.
- the Sprague Dawley rat was selected for this study because it was the rat strain used in the toxicology program conducted with Lovaza ® , and thus permitted direct comparison of the data from the present study with Epanova ® to publicly available rat toxicity data in the Lovaza ® Summary Basis of Approval.
- the Sprague Dawley rats provide a model that is recognized to predict the effects of omega-3 PUFAs on lipid changes for triglycerides and total cholesterol in human subjects. Results at 13 weeks are shown in Table 32, below.
- Epanova provided not only markedly higher maximum plasma concentrations (C max ) of DHA and EPA than Lovaza ® , but also provided markedly higher AUC ( o-t) for the two omega-3 species; AUC( 0 . t ) is a measure of systemic exposure.
- C max maximum plasma concentrations
- AUC( 0 . t ) is a measure of systemic exposure.
- the greater bioavailability and long term systemic exposure of these two omega-3 PUFA species with Epanova ® therapy resulted in long term differences in lipid lowering efficacy, with Epanova ® effecting substantially greater reductions in plasma triglycerides and in total cholesterol than was seen with LOVAZA ® .
- the compositions described herein thus provide greater efficacy with respect to two clinically important cardiovascular parameters.
- STUDY DRUG (Epanova ® ) - Type A porcine soft gelatin capsules were prepared, each containing one gram (lg) of a PUFA composition comprising omega-3 PUFAs in free acid form ("API").
- the capsules were coated with Eudragit NE 30-D (Evonik Industries AG).
- the API had the composition given in batch 2 of Table 10 ⁇ see Example 4, above).
- PLACEBO - Capsules were prepared containing olive oil for use as a control.
- FIG. 19 shows the disposition of all subjects, with "AE” abbreviating "adverse event” and "SAE” abbreviating "serious adverse event.”
- a total of 1,356 subjects were initially screened, and of these, 399 were selected to participate in the study. Of the 399 subjects, 99 received olive oil placebo, 100 received Epanova ® 2 g/day; 101 received Epanova ® 3 g/day; and 99 received Epanova ® 4 g/day.
- Table 33 shows average triglyceride (TG) and cholesterol measurements for the subjects at randomization (prior to treatment), in comparison to desirable levels as described by the Third Report of the Expert Panel on Detection, Evaluation, and Treatment of High Blood Cholesterol in Adults (Adult Treatment Panel III), produced by the National Heart Lung and Blood Institute.
- Epanova achieved the primary endpoint of triglyceride reduction and the secondary endpoint of reduction of non-HDL cholesterol (total cholesterol level minus the level of HDL-cholesterol) ("non-HDL-C") at all doses, and produced statistically significant reductions in multiple established markers of atherogenicity: Apo B, Apo CIII, RLP, and LpPLA2.
- Epanova ® provided additive efficacy on key lipid parameters: TG; non-HDL-C; HLD-c; total cholesterol (TC); and TC/HDL-C.
- Plasma levels of EPA, DHA, and DP A - the three species of omega-3 lc-PUFA in greatest abundance in Epanova ® - were measured at baseline and at end-of treatment (EOT), as were plasma levels of the omega-6 lc-PUFA, arachidonic acid (AA).
- EOT end-of treatment
- Table 34 separately tabulates average baseline, median baseline, average end-of-treatment (EOT), and median EOT plasma levels for EPA, DHA, DP A, and AA, as well as TG, NHDL-C, HDL-C, VLDL-C, and LDL-C.
- FIGS. 20 A - 20E plot the average baseline and end-of-treatment ("EOT") plasma levels (in ⁇ g/mL) for EPA (FIG. 20A), DHA (FIG. 20B), DPA (FIG. 20C) and AA (FIG. 20D), for each of the treatment arms in the EVOLVE trial.
- FIG. 20E compares average baseline and EOT EPA levels for each treatment arm and the control (olive oil) arm to values earlier reported for ECLIPSE (see Example 7), 14-day bioavailability study( see Example 8), a statin drug-drug-interaction study (Statin DDI), and the unrelated JELIS trial conducted by others with a different omega-3 PUFA formulation (“JELIS").
- EOT end-of-treatment
- FIGS. 21 A - 21D plot median baseline and end-of-treatment (EOT) plasma levels (in ⁇ g/mL) for EPA (FIG. 21 A), DHA (FIG. 21B), DPA (FIG. 21C), and AA (FIG. 21D).
- EOT end-of-treatment
- Baseline EOT Baseline EOT (Median) (Average) (Average) (Median)
- Baseline EOT Baseline EOT (Median) (Average) (Average) (Median)
- RLP (mg/dL) 2g 55.5 49.7 49.7 37
- Table 35 tabulates the average change and the median change in absolute plasma levels from baseline to EOT for EPA, DHA, DP A, and AA, as well as TG, NHDL-C, HDL-C, VLDL-C, and LDL-C.
- FIGS. 22A, 22B, 26 A, and 26B plot the data in the table above, showing the change from baseline to EOT in absolute plasma levels (in ⁇ g/mL) of AA, DHA, EPA, and DPA for each of the treatment arms of the EVOLVE trial, with FIG. 22A plotting average change and FIG. 22B showing median change from baseline.
- Table 36A separately tabulates average, median, and least squares mean percentage change from baseline to EOT in plasma levels of EPA, DHA, DPA, and AA, as well as TG, NHDL-C, HDL-C, VLDL-C, and LDL-C, for each of the treatment arms of the EVOLVE trial.
- Table 2 IB separately tabulates percentage change from baseline to EOT and LS mean change in the average and median plasma levels of ApoB, ApoCIII, LpPLA2, and RLP, for each of the treatment arms of the EVOLVE trial.
- FIG. 23 A plots the average change from baseline to EOT, as percentage of baseline value, for AA, DHA, EPA, and DPA in each of the treatment arms of the EVOLVE trial, and FIG. 23B plots the median percent change from baseline to EOT.
- Table 37 below presents EPA/AA ratios at beginning and end-of-treatment for each of the treatment arms of the EVOLVE trial.
- FIG. 26A and FIG. 26B which plot the average and median, respectively, for the absolute change from baseline.
- FIG. 27 illustrates the percentage of subjects who exhibited 0-10% reduction in TG, 10-20% reduction in TG, 20-30% reduction in TG, 30-40% reduction in TG, 40-50% reduction in TG, and greater than 50% reduction in TG, for
- Epanova ® 2g and 4g doses Epanova ® 2g and 4g doses.
- FIG. 26A and FIG. 26B also show that non-HDL-C and VLDL-C were reduced, while HDL-C was elevated. LDL-C levels were also elevated, a measurement that is likely due to an increase in LDL particle size upon treatment (discussed further in Example 12).
- FIG. 24A Non-HDL-C (FIG. 24B), HDL-C (FIG. 24C), V-LDL-C (FIG. 24D), LDL-C (FIG. 24E), ApoB (FIG. 24F), ApoCIII (FIG. 24G), RLP (FIG. 24H), and LpPLA2 (FIG.
- FIGS. 25A - 251 Absolute median baseline and EOT levels are plotted in FIGS. 25A - 251 for TG (FIG. 25A), Non-HDL-C (FIG. 25B), HDL-C (FIG. 25C), V-LDL-C (FIG. 25D), LDL-C (FIG.
- FIG. 29 plots the rate of change in the median percentage change from baseline in plasma levels of EPA, DHA, DP A, AA, TG, non-HDL-C, and HDL-C (absolute value) between 2g and 4g doses of Epanova ® .
- Table 38 tabulates the results:
- Epanova ® thus exhibits unprecedented potency in ability to reduce AA levels.
- Apolipoprotein CIII (ApoCIII) was significantly reduced by Epanova ® treatment.
- ApoCIII inhibits lipoprotein lipase activity and hepatic uptake of triglyceride-rich lipoproteins. Elevated levels of ApoCIII have been found to be an independent predictor for cardiovascular heart disease (CHD) risk while genetically reduced ApoCIII is associated with protection from CHD.
- CHD cardiovascular heart disease
- Omega-3 fatty acid formulations containing DHA have been shown to increase LDL- C in patients with severe hypertriglyceridemia (Kelley et al., 2009, J Nutrition, 139(3):495- 501). This effect on LDL-C is postulated to be a result of increased lipoprotein particle size (Davidson et al., 2009, J Clin. Lipidology, 3(5):332-340).
- FIG. 34 shows the correlation between percent change in LDL and percent change in ApoCIII for data from the EVOLVE trial.
- a Pearson correlation coefficient of -0.28 was obtained when these data were fit using a linear regression, demonstrating that increases in LDL correlated with decreases in ApoCIII upon treatment with Epanova ® .
- LPL Type 1 lipoprotein lipase
- STUDY DRUG (Epanova ® ) - Type A porcine soft gelatin capsules were prepared, each containing one gram (lg) of a PUFA composition comprising omega-3 PUFAs in free acid form ("API").
- the capsules were coated with Eudragit NE 30-D (Evonik Industries AG).
- the API had the . composition given in batch 3 of Table 9 (see Example 4, above).
- Treatment condition "A” consisted of co-administration of an oral dose of 40 mg of simvastatin (1 tablet), 81 mg of aspirin (1 tablet) and 4 g (4 capsules) of Epanova ® , once a day (every 24 hours) with 240 mL of water on the mornings of Days 1 to 14, for a total of 14 doses, under fasting conditions.
- Treatment condition "B” consisted of administration of an oral dose of 40 mg of simvastatin (1 tablet) and 81 mg of aspirin (1 tablet) once a day (every 24 hours) with 240 mL of water on the mornings of Days 1 to 14, for a total of 14 doses, under fasting conditions. There was a 14 day washout between treatments.
- EOT end-of-treatment
- FIG. 56 shows arachidonic acid (AA) plasma levels for subjects grouped according to genotype at the rs 174546 SNP, at (A) baseline (in ⁇ g/mL), and (B) day 15 of treatment with Epanova® (in percent change from baseline).
- AA arachidonic acid
- the interquartile range is indicated by a box
- the median is indicated by a horizontal line in the interior of the interquartile box
- the mean is represented by a diamond.
- Outliers are represented by open circles. The whiskers extend to the minimum and maximum non-outlier value.
- Score 1 identifies subjects who are homozygous at the major allele
- Score 3 identifies subjects homozygous at the minor allele
- Score 2 represents heterozygotes.
- STUDY DRUG (Epanova®) - Type A porcine soft gelatin capsules were prepared, each containing one gram (lg) of a PUFA composition comprising omega-3 PUFAs in free acid form ("API").
- the capsules were coated with Eudragit NE 30-D (Evonik Industries AG).
- the API had the composition given in batch 3 of Table 9 (see Example 4, above).
- PLACEBO - Capsules were prepared containing olive oil for use as a control. 6.12.2. STUDY DESIGN
- a subset of subjects in the 2g treatment arm of the EVOLVE trial who were receiving concurrent statin therapy displayed greater magnitudes of percentage changes (mean LS difference), relative to control, for TG, non-HDL-C, HDL-C, LDL-C, TC, VLDL-C, and TC/HDL-C, when compared to those subjects in the 2g treatment arm who did not receive concurrent statin therapy.
- Subjects receiving concurrent statin therapy showed a dose-dependent response to Epanova ® , as shown in comparative data for Epanova ® 2g and Epanova ® 4g displayed in FIG. 39.
- Epanova ® 2g dose, and 220 were treated with Epanova ® 4g dose. All placebo and Epanova ® treatments were administered in addition to the baseline statin therapy.
- Table 41 shows the baseline levels for TG, HDL-C, LDL-C, non-HDL-C, and VLDL-C for subjects in the ESPRIT trial, in comparison to desirable levels as described by the Third Report of the Expert Panel on Detection, Evaluation, and Treatment of High Blood Cholesterol in Adults (Adult Treatment Panel III), issued by the National Heart Lung and Blood Institute.
- FIG. 41 illustrates the patient disposition for the ESPRIT trial, showing that 6 patients were withdrawn from the placebo arm, 6 patients were withdrawn from the 2g treatment arm, and 12 patients were withdrawn from the 4g treatment arm.
- the number of patients who experienced adverse effects (AE) was low overall, with 2 in the placebo arm, 3 in the 2g treatment arm, and 7 in the 4g treatment arm.
- FIGS. 45 - 52 Further details of the results of the ESPRIT trial are presented in FIGS. 45 - 52, demonstrating that Epanova ® is efficacious as an add-on to both low-potency and high- potency statins, in a range of baseline patient conditions.
- FIG. 45 shows the results for median TG percentage change from baseline for three tertiles of patients, partitioned by baseline TG levels.
- FIG. 46 shows the results for median non-HDL-C percentage change from baseline for three tertiles of patients, partitioned by baseline non-HDL-C levels.
- FIG. 47 shows the results for median LDL-C percentage change from baseline for three tertiles of patients, partitioned by baseline LDL-C levels.
- FIGS. 49-51 are identical to FIGS. 49-51.
- FIG. 52 compares median percentage changes from baseline for triglycerides for (A) patients having higher TG baseline levels (> 294 mg/dL), (B) patients having high EOT EPA levels (> 26.58 ⁇ g/mL), and (C) patients receiving concurrent rosuvastatin therapy.
- the results show that the Epanova 2g dose works similarly to the 4g dose in those patient populations shown in FIG. 52.
Abstract
Description


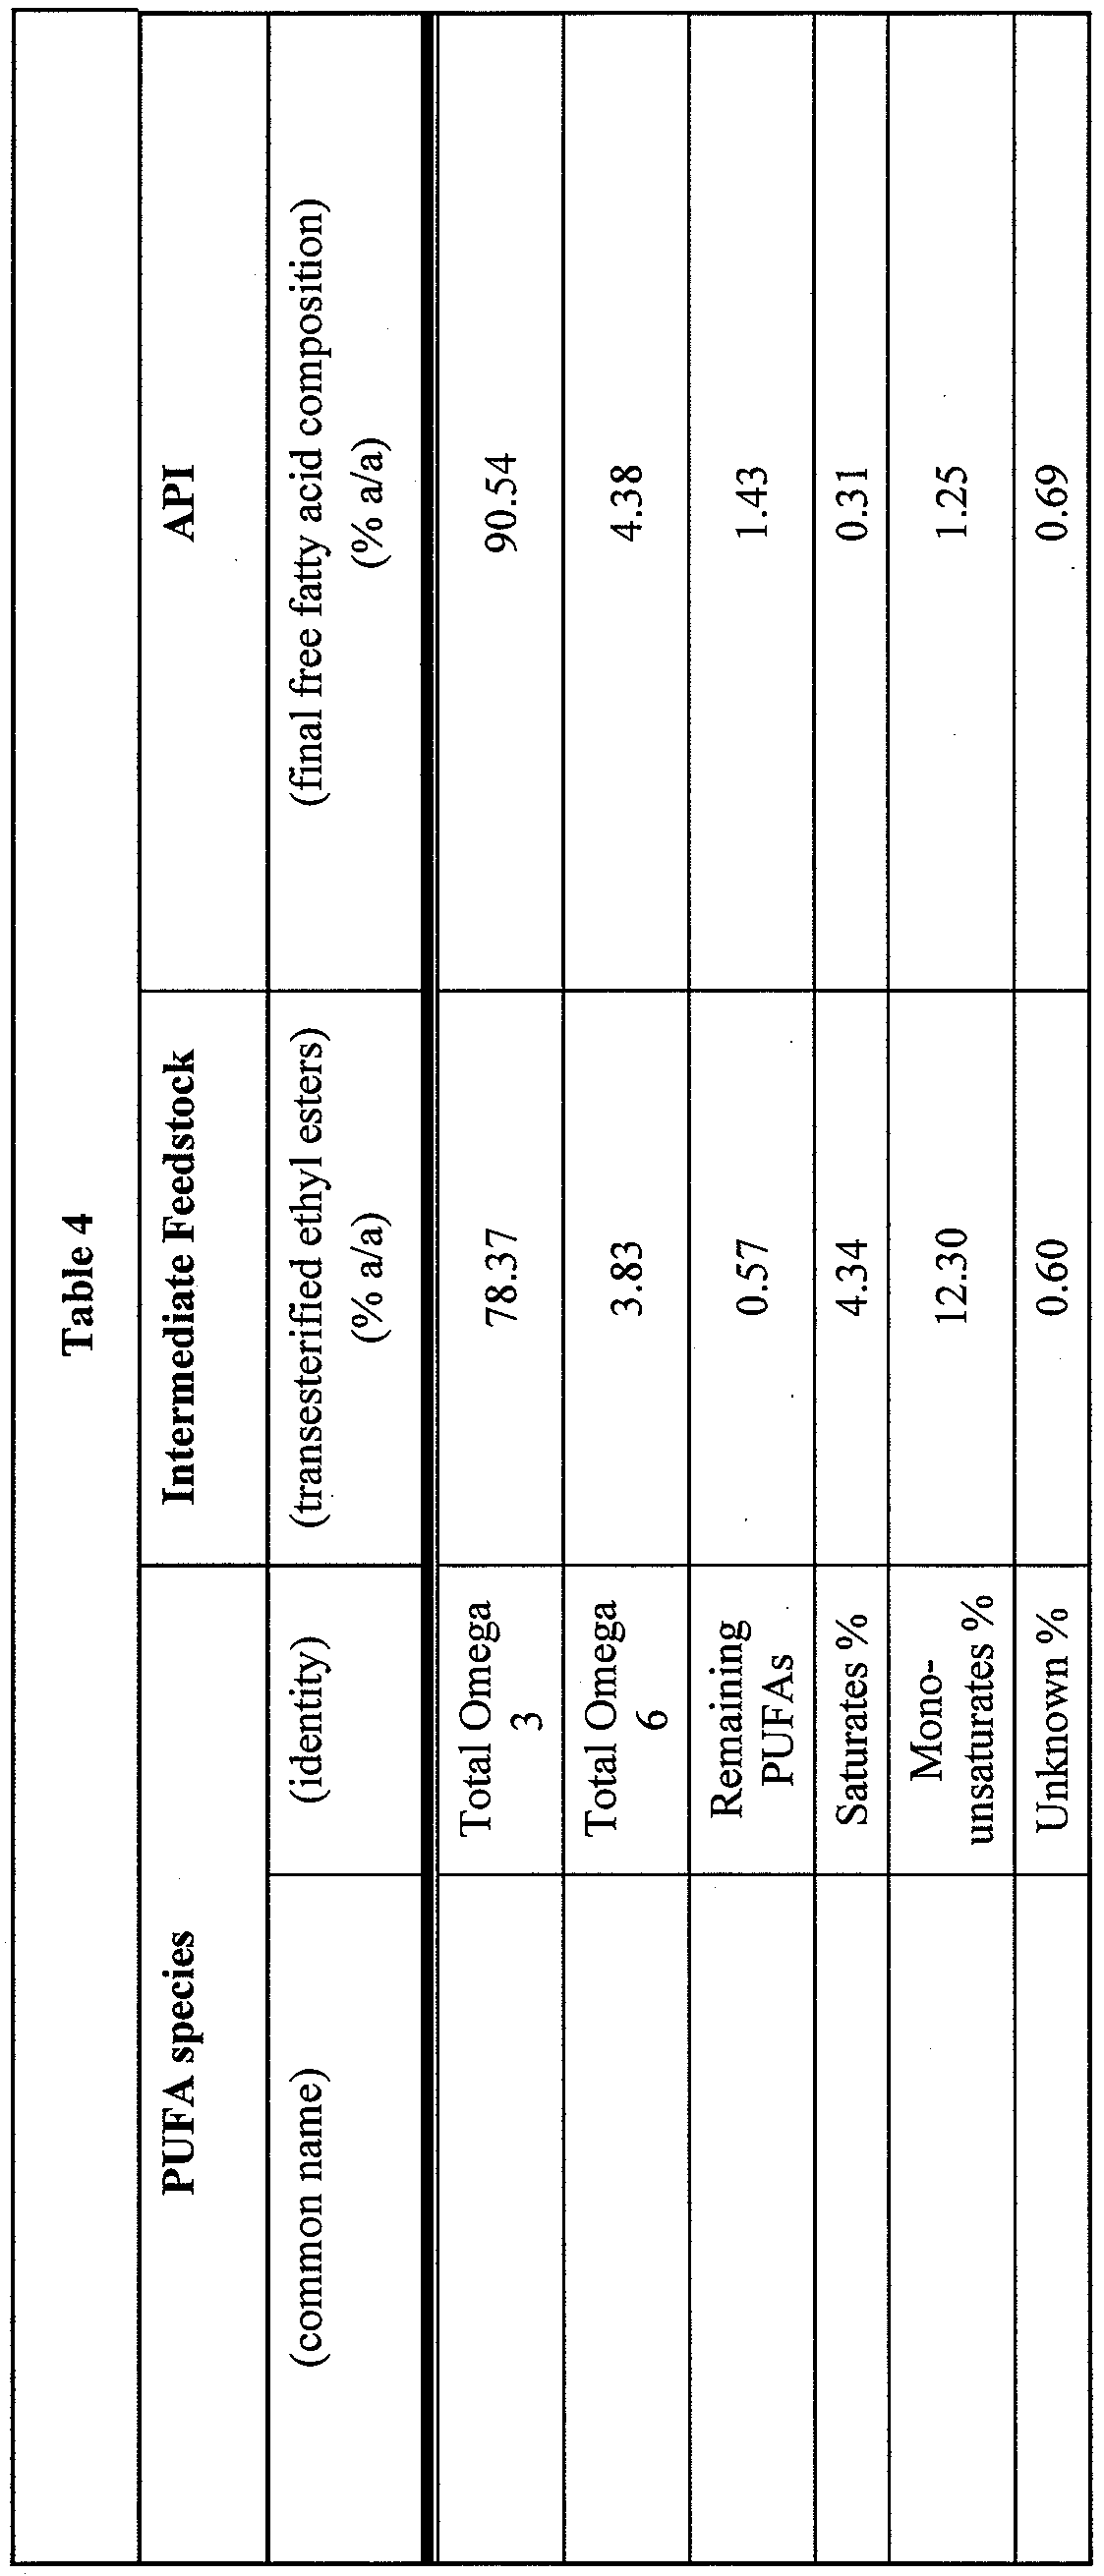


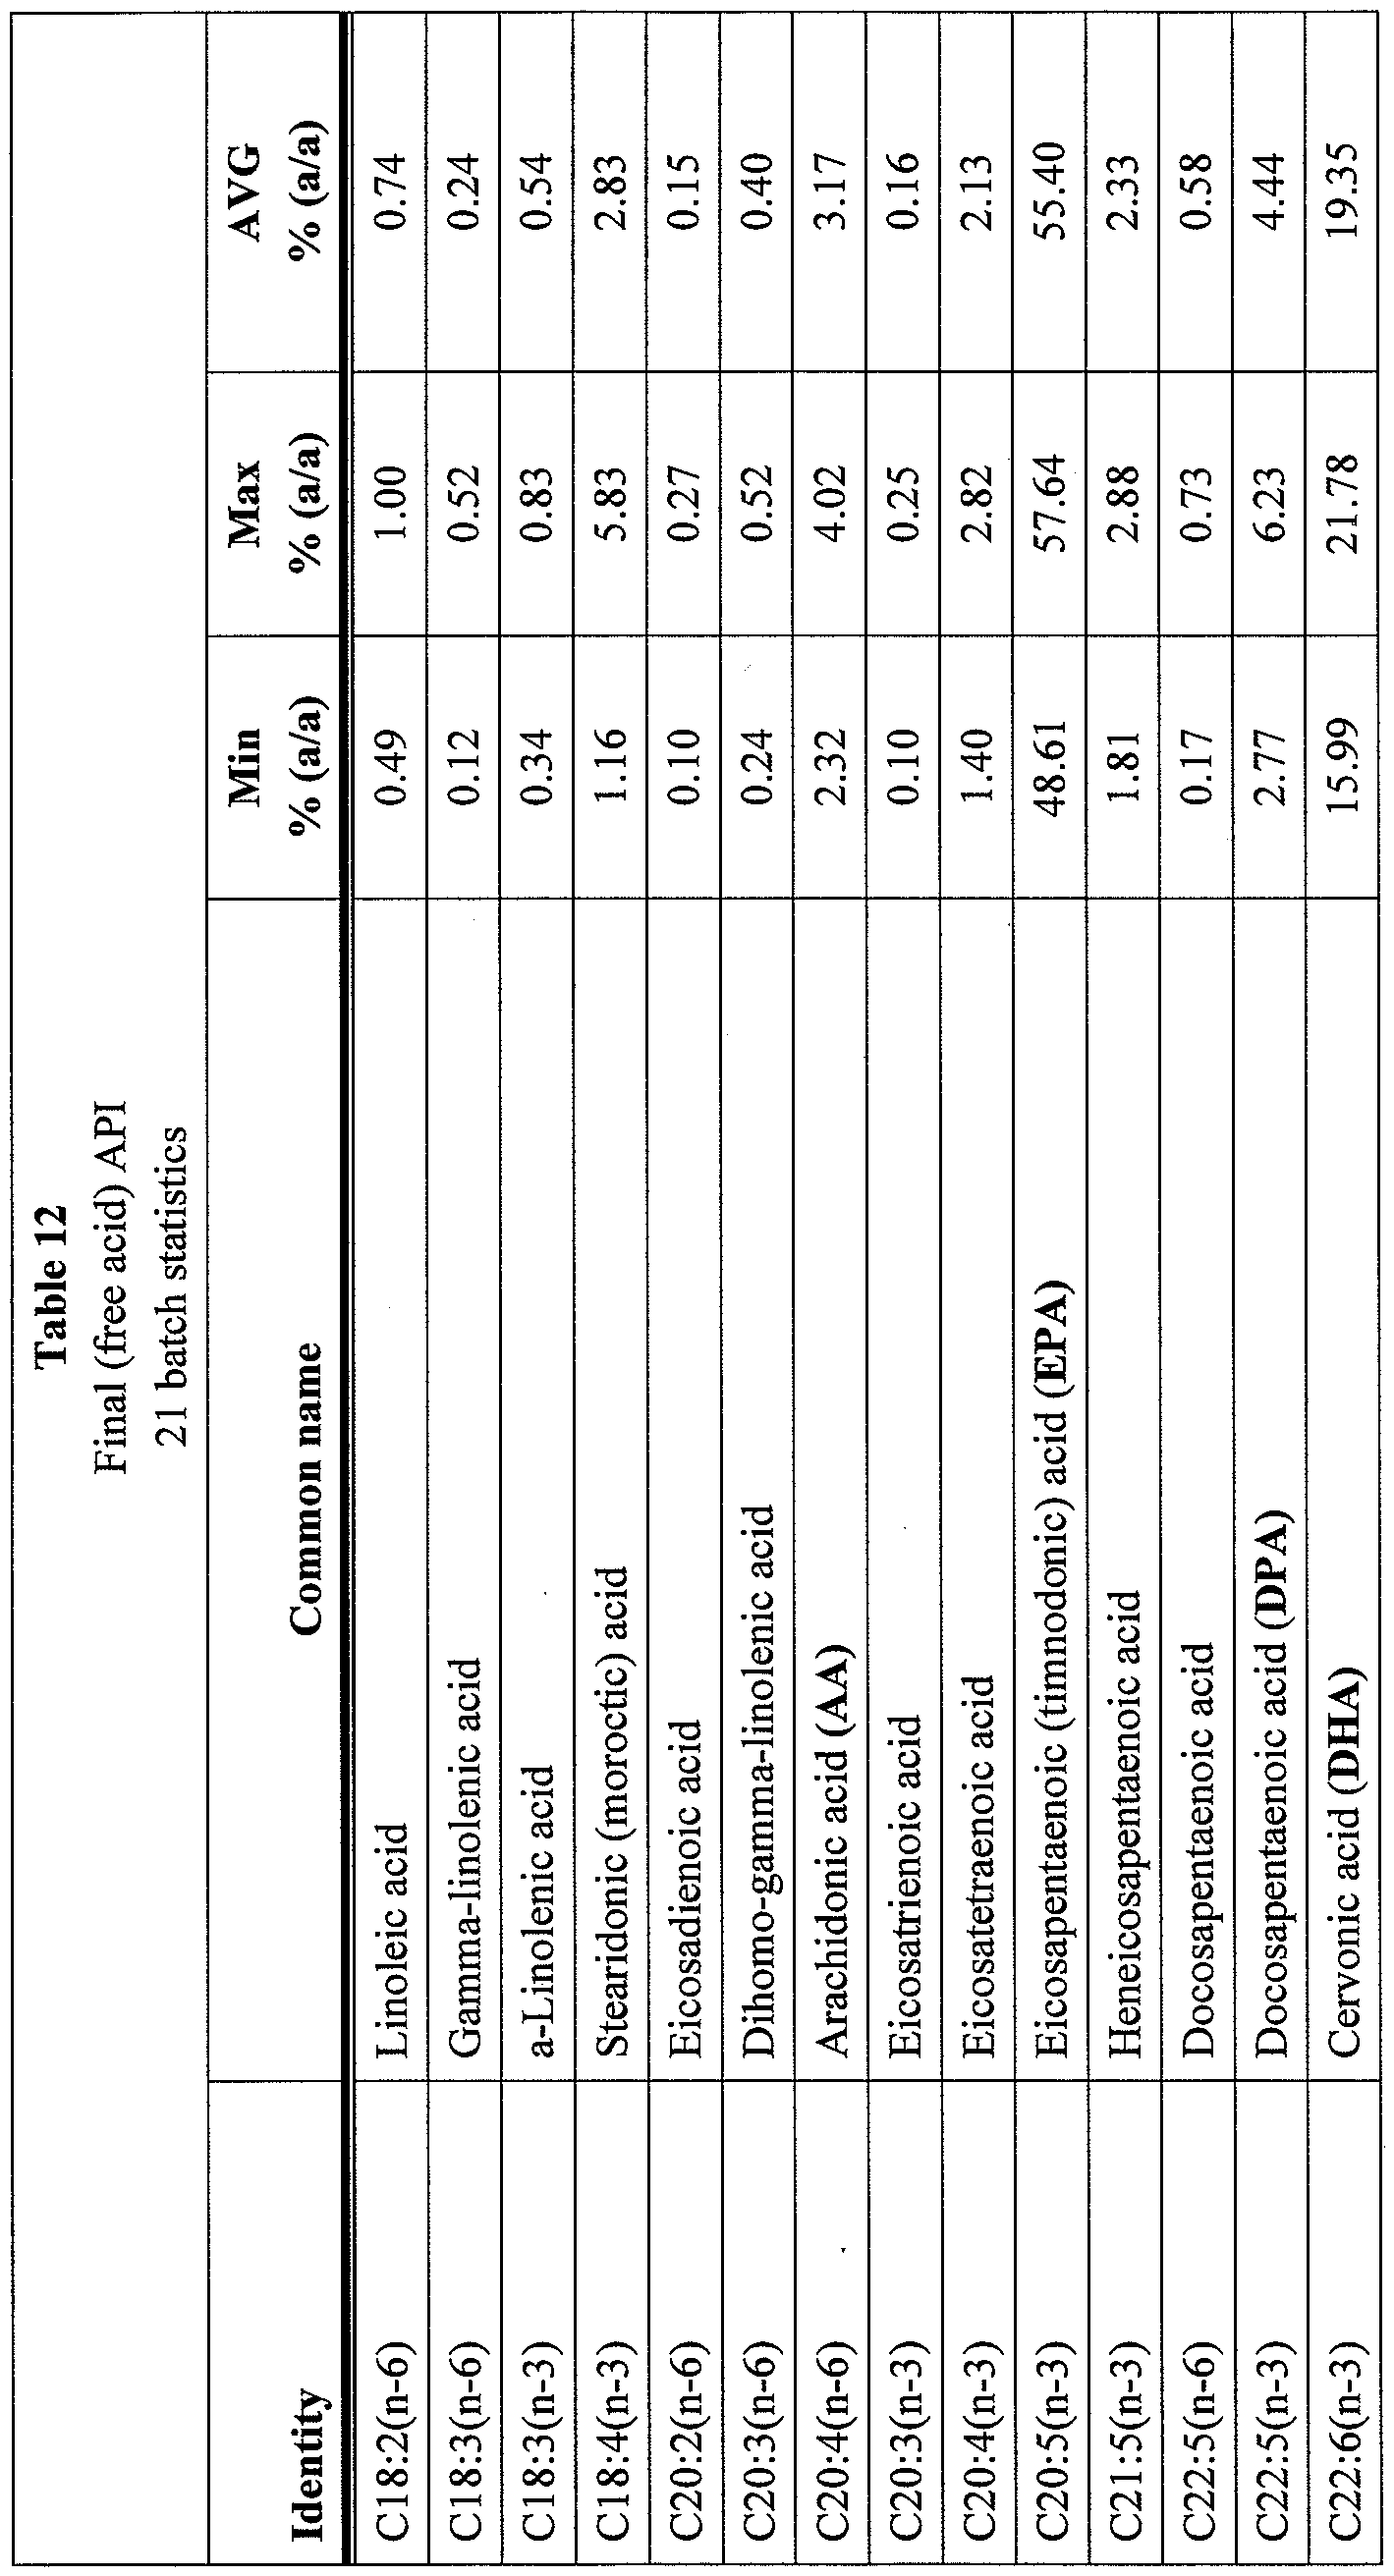


Claims
Priority Applications (32)
| Application Number | Priority Date | Filing Date | Title |
|---|---|---|---|
| ES13733671.5T ES2685703T3 (en) | 2012-01-06 | 2013-01-04 | Compositions enriched in DPA of polyunsaturated omega-3 fatty acids in the form of free acid |
| JP2014551376A JP6399655B2 (en) | 2012-01-06 | 2013-01-04 | DPA concentrated composition of free acid omega-3 polyunsaturated fatty acid |
| DK13733671.5T DK2800563T3 (en) | 2012-01-06 | 2013-01-04 | DPA Enriched Compositions of Multi-Saturated Omega-3 Fatty Acids in Free Acid Form |
| CA2860512A CA2860512C (en) | 2012-01-06 | 2013-01-04 | Dpa-enriched compositions of omega-3 polyunsaturated fatty acids in free acid form |
| NZ626699A NZ626699A (en) | 2012-01-06 | 2013-01-04 | Dpa-enriched compositions of omega-3 polyunsaturated fatty acids in free acid form |
| SI201331151T SI2800563T1 (en) | 2012-01-06 | 2013-01-04 | Dpa-enriched compositions of omega-3 polyunsaturated fatty acids in free acid form |
| SG11201403805WA SG11201403805WA (en) | 2012-01-06 | 2013-01-04 | Dpa-enriched compositions of omega-3 polyunsaturated fatty acids in free acid form |
| UAA201407804A UA114615C2 (en) | 2012-01-06 | 2013-01-04 | Dpa-enriched compositions of omega-3 polyunsaturated fatty acids in free acid form |
| AU2013201793A AU2013201793B2 (en) | 2012-01-06 | 2013-01-04 | DPA-enriched compositions of omega-3 polyunsaturated fatty acids in free acid form |
| BR112014016788A BR112014016788A8 (en) | 2012-01-06 | 2013-01-04 | free acid omega-3 polyunsaturated fatty acid compositions enriched with dpa |
| RU2014128500A RU2664429C2 (en) | 2012-01-06 | 2013-01-04 | Dpa-enriched compositions of omega-3 polyunsaturated fatty acids in free acid form |
| RS20181033A RS57777B1 (en) | 2012-01-06 | 2013-01-04 | Dpa-enriched compositions of omega-3 polyunsaturated fatty acids in free acid form |
| EP18158463.2A EP3348262A1 (en) | 2012-01-06 | 2013-01-04 | Methods for making dpa-enriched compositions of omega-3 polyunsaturated fatty acids in free acid form |
| KR1020197029482A KR102153245B1 (en) | 2012-01-06 | 2013-01-04 | Dpa-enriched compositions of omega-3 polyunsaturated fatty acids in free acid form |
| PL13733671T PL2800563T3 (en) | 2012-01-06 | 2013-01-04 | Dpa-enriched compositions of omega-3 polyunsaturated fatty acids in free acid form |
| EP13733671.5A EP2800563B1 (en) | 2012-01-06 | 2013-01-04 | Dpa-enriched compositions of omega-3 polyunsaturated fatty acids in free acid form |
| CN201380012754.2A CN104321055A (en) | 2012-01-06 | 2013-01-04 | DPA-enriched compositions of omega-3 polyunsaturated fatty acids in free acid form |
| MX2014008309A MX358319B (en) | 2012-01-06 | 2013-01-04 | Dpa-enriched compositions of omega-3 polyunsaturated fatty acids in free acid form. |
| IN6125DEN2014 IN2014DN06125A (en) | 2012-01-06 | 2013-01-04 | |
| US14/370,730 US20150004224A1 (en) | 2012-01-06 | 2013-01-04 | Dpa-enriched compositions of omega-3 polyunsaturated fatty acids in free acid form |
| KR1020147021557A KR102153143B1 (en) | 2012-01-06 | 2013-01-04 | Dpa-enriched compositions of omega-3 polyunsaturated fatty acids in free acid form |
| LTEP13733671.5T LT2800563T (en) | 2012-01-06 | 2013-01-04 | Dpa-enriched compositions of omega-3 polyunsaturated fatty acids in free acid form |
| IL233517A IL233517A (en) | 2012-01-06 | 2014-07-03 | Dpa-enriched compositions of omega-3 polyunsaturated fatty acids in free acid form |
| PH12014501553A PH12014501553B1 (en) | 2012-01-06 | 2014-07-04 | Dpa-enriched compositions of omega-3 polyunsaturated fatty acids in free acid form |
| CR20140350A CR20140350A (en) | 2012-01-06 | 2014-07-22 | ENRICHED COMPOSITIONS WITH OMEGA 3 POLYINSATURED FATTY ACIDS DPA IN A FREE ACID FORM |
| ZA2014/05765A ZA201405765B (en) | 2012-01-06 | 2014-08-05 | Dpa-enriched compositions of omega-3 polyunsaturated fatty acids in free acid form |
| HK15102685.9A HK1202073A1 (en) | 2012-01-06 | 2015-03-17 | Dpa-enriched compositions of omega-3 polyunsaturated fatty acids in free acid form -3 dpa |
| PH12015502307A PH12015502307A1 (en) | 2012-01-06 | 2015-10-06 | Dpa-enriched compositions of omega-3 polyunsaturated fatty acids in free acid form |
| IL252084A IL252084B (en) | 2012-01-06 | 2017-05-03 | Dpa-enriched compositions of omega-3 polyunsaturated fatty acids in free acid form |
| HRP20181418TT HRP20181418T1 (en) | 2012-01-06 | 2018-09-05 | Dpa-enriched compositions of omega-3 polyunsaturated fatty acids in free acid form |
| CY181100930T CY1120663T1 (en) | 2012-01-06 | 2018-09-06 | DPA-ENRICHED COMPOSITIONS OF OMEGA-3 FULL-SATURATED FATTY ACIDS IN THE FORM OF FREE ACID |
| IL266231A IL266231B (en) | 2012-01-06 | 2019-04-24 | Dpa-enriched compositions of omega-3 polyunsaturated fatty acids in free acid form |
Applications Claiming Priority (12)
| Application Number | Priority Date | Filing Date | Title |
|---|---|---|---|
| US201261583796P | 2012-01-06 | 2012-01-06 | |
| US61/583,796 | 2012-01-06 | ||
| US201261664047P | 2012-06-25 | 2012-06-25 | |
| US61/664,047 | 2012-06-25 | ||
| US201261669940P | 2012-07-10 | 2012-07-10 | |
| US61/669,940 | 2012-07-10 | ||
| US201261680622P | 2012-08-07 | 2012-08-07 | |
| US61/680,622 | 2012-08-07 | ||
| US201261710517P | 2012-10-05 | 2012-10-05 | |
| US61/710,517 | 2012-10-05 | ||
| US201261713388P | 2012-10-12 | 2012-10-12 | |
| US61/713,388 | 2012-10-12 |
Publications (1)
| Publication Number | Publication Date |
|---|---|
| WO2013103902A1 true WO2013103902A1 (en) | 2013-07-11 |
Family
ID=48744082
Family Applications (1)
| Application Number | Title | Priority Date | Filing Date |
|---|---|---|---|
| PCT/US2013/020398 WO2013103902A1 (en) | 2012-01-06 | 2013-01-04 | Dpa-enriched compositions of omega-3 polyunsaturated fatty acids in free acid form |
Country Status (34)
| Country | Link |
|---|---|
| US (5) | US20150004224A1 (en) |
| EP (2) | EP2800563B1 (en) |
| JP (3) | JP6399655B2 (en) |
| KR (2) | KR102153143B1 (en) |
| CN (3) | CN107050457A (en) |
| BR (1) | BR112014016788A8 (en) |
| CA (1) | CA2860512C (en) |
| CL (1) | CL2014001803A1 (en) |
| CO (1) | CO7061070A2 (en) |
| CY (1) | CY1120663T1 (en) |
| DK (1) | DK2800563T3 (en) |
| DO (1) | DOP2014000159A (en) |
| EC (1) | ECSP14012527A (en) |
| ES (1) | ES2685703T3 (en) |
| HK (2) | HK1251457A1 (en) |
| HR (1) | HRP20181418T1 (en) |
| HU (1) | HUE039659T2 (en) |
| IL (3) | IL233517A (en) |
| IN (1) | IN2014DN06125A (en) |
| LT (1) | LT2800563T (en) |
| MX (1) | MX358319B (en) |
| MY (1) | MY165048A (en) |
| NZ (1) | NZ626699A (en) |
| PE (1) | PE20142459A1 (en) |
| PH (2) | PH12014501553B1 (en) |
| PL (1) | PL2800563T3 (en) |
| PT (1) | PT2800563T (en) |
| RS (1) | RS57777B1 (en) |
| RU (2) | RU2018116572A (en) |
| SG (2) | SG11201403805WA (en) |
| SI (1) | SI2800563T1 (en) |
| UA (1) | UA114615C2 (en) |
| WO (1) | WO2013103902A1 (en) |
| ZA (1) | ZA201405765B (en) |
Cited By (16)
| Publication number | Priority date | Publication date | Assignee | Title |
|---|---|---|---|---|
| WO2014040921A1 (en) * | 2012-09-13 | 2014-03-20 | Chrysalis Pharma Ag | A pharmaceutical composition |
| WO2014063190A1 (en) * | 2012-10-23 | 2014-05-01 | Deakin University | Method for reducing triglycerides |
| WO2015011724A2 (en) | 2013-07-22 | 2015-01-29 | Kms Health Center Pvt Ltd | A novel omega -3 fatty acid composition with a plant extract |
| WO2015024055A1 (en) * | 2013-08-20 | 2015-02-26 | Deakin University | Separation of omega-3 fatty acids |
| US9242008B2 (en) | 2014-06-18 | 2016-01-26 | Thetis Pharmaceuticals Llc | Mineral amino-acid complexes of fatty acids |
| WO2016178066A1 (en) * | 2015-05-01 | 2016-11-10 | Mohan M Alapati | Compositions and methods for the treatment of hyperglycemia and metabolic syndrome |
| US9492545B2 (en) | 2012-05-07 | 2016-11-15 | Omthera Pharmaceuticals Inc. | Compositions of statins and omega-3 fatty acids |
| US9505709B2 (en) | 2014-05-05 | 2016-11-29 | Thetis Pharmaceuticals Llc | Compositions and methods relating to ionic salts of peptides |
| WO2018015175A1 (en) | 2016-07-08 | 2018-01-25 | Astrazeneca Ab | Pharmaceutical compositions |
| US9999626B2 (en) | 2014-06-18 | 2018-06-19 | Thetis Pharmaceuticals Llc | Mineral amino-acid complexes of active agents |
| US10105333B2 (en) | 2014-06-04 | 2018-10-23 | Ds Biopharma Limited | Pharmaceutical compositions comprising DGLA and use of same |
| US10117844B2 (en) | 2012-01-06 | 2018-11-06 | Omthera Pharmaceuticals, Inc. | DPA-enriched compositions of omega-3 polyunsaturated fatty acids in free acid form |
| US10130719B2 (en) | 2016-06-03 | 2018-11-20 | Thetis Pharmaceuticals Llc | Compositions and methods relating to salts of specialized pro-resolving mediators |
| US10328046B2 (en) | 2009-04-29 | 2019-06-25 | Ds Biopharma Limited | Topical compositions comprising polyunsaturated fatty acids |
| US10512611B2 (en) | 2015-02-23 | 2019-12-24 | Omthera Pharmaceuticals Inc. | Millicapsule formulations comprising polyunsaturated free fatty acids |
| US11872201B2 (en) | 2018-06-21 | 2024-01-16 | Nuseed Nutritional Us Inc. | DHA enriched polyunsaturated fatty acid compositions |
Families Citing this family (17)
| Publication number | Priority date | Publication date | Assignee | Title |
|---|---|---|---|---|
| EP2861227A4 (en) | 2012-06-17 | 2016-01-27 | Matinas Biopharma Inc | Omega-3 pentaenoic acid compositions and methods of use |
| US9629820B2 (en) | 2012-12-24 | 2017-04-25 | Qualitas Health, Ltd. | Eicosapentaenoic acid (EPA) formulations |
| US10123986B2 (en) | 2012-12-24 | 2018-11-13 | Qualitas Health, Ltd. | Eicosapentaenoic acid (EPA) formulations |
| GB201301626D0 (en) | 2013-01-30 | 2013-03-13 | Dignity Sciences Ltd | Composition comprising 15-OHEPA and methods of using the same |
| US9452151B2 (en) * | 2013-02-06 | 2016-09-27 | Amarin Pharmaceuticals Ireland Limited | Methods of reducing apolipoprotein C-III |
| EP3738586A1 (en) | 2013-10-30 | 2020-11-18 | Patheon Softgels Inc. | Enteric soft capsules comprising polyunsaturated fatty acids |
| WO2015071766A1 (en) | 2013-11-15 | 2015-05-21 | Dignity Sciences Limited | Pharmaceutically acceptable salts of polyunsaturated hydroxy fatty acids |
| US9895333B2 (en) | 2014-06-26 | 2018-02-20 | Patheon Softgels Inc. | Enhanced bioavailability of polyunsaturated fatty acids |
| WO2016069446A1 (en) * | 2014-10-28 | 2016-05-06 | Omthera Pharmaceuticals Inc | Methods for modulating plasma levels of lipoproteins |
| WO2016073335A1 (en) * | 2014-11-05 | 2016-05-12 | Omthera Pharmaceuticals Inc. | Methods of treatment |
| US20160192126A1 (en) * | 2014-12-31 | 2016-06-30 | Silver Spring Networks, Inc. | System and method for tracking a device |
| ES2851525T3 (en) | 2015-07-21 | 2021-09-07 | Afimmune Ltd | Compositions comprising 15 (S) -HEPE for use in sensitizing cancer cells to radiation therapy |
| US10263794B2 (en) * | 2016-05-19 | 2019-04-16 | Linear Technology Corporation | Maintain power signature controller at power interface of PoE or PoDL system |
| WO2019008101A1 (en) | 2017-07-06 | 2019-01-10 | Evonik Technochemie Gmbh | Enteric coated solid dosage form comprising omega-3 fatty acid amino acid salts |
| KR102628351B1 (en) | 2017-08-15 | 2024-01-25 | 에보니크 오퍼레이션즈 게엠베하 | Tablets with high active ingredient content of omega-3 fatty acid amino acid salts |
| US20220287345A1 (en) | 2019-08-08 | 2022-09-15 | Evonik Operations Gmbh | Solubility enhancement of poorly soluble actives |
| CA3146612A1 (en) | 2019-08-08 | 2021-02-11 | Evonik Operations Gmbh | Down streaming process for the production of polyunsaturated fatty acid salts |
Citations (29)
| Publication number | Priority date | Publication date | Assignee | Title |
|---|---|---|---|---|
| US4377526A (en) | 1981-05-15 | 1983-03-22 | Nippon Suisan Kaisha, Ltd. | Method of purifying eicosapentaenoic acid and its esters |
| US5106542A (en) | 1986-12-17 | 1992-04-21 | Nestec S.A. | Process for the continuous fractionation of a mixture of fatty acids |
| US5243046A (en) | 1986-12-17 | 1993-09-07 | Nestec S.A. | Process for the continuous fractionation of a mixture of fatty acids |
| US5472705A (en) | 1992-08-11 | 1995-12-05 | Prospa B.V. | Pharmaceutical composition containing esters of ω-3 polyunsaturated acids and their use in the topical treatment of morbid affections |
| US5502077A (en) | 1988-08-11 | 1996-03-26 | Norsk Hydro A.S. | Fatty acid composition |
| US5679809A (en) | 1994-05-09 | 1997-10-21 | Nestec S.A. | Concentrate of polyunsaturated fatty acid ethyl esters and preparation thereof |
| US5719302A (en) | 1993-04-29 | 1998-02-17 | Pronova A.S | Processes for chromatographic fractionation of fatty acids and their derivatives |
| US5750572A (en) | 1993-12-14 | 1998-05-12 | Prospa B.V. | Salts of a polyunsaturated fatty acid and pharmaceutical formulations containing them |
| US5776978A (en) | 1994-08-25 | 1998-07-07 | Prospa B.V. | Pharmaceutical preparations containing polyunsaturated fatty acids, their esters or salts, together with antioxidant vitamins or provitamins |
| US5792795A (en) | 1995-05-15 | 1998-08-11 | Tillotts Pharma Ag | Treatment of inflammatory bowel disease using oral dosage forms of omega-3 polyunsaturated acids |
| US5869714A (en) | 1994-10-20 | 1999-02-09 | Prospa B.V. | Salts of omega-3-polyunsaturated fatty acids and pharmaceutical formulations containing them |
| US5945318A (en) | 1994-03-08 | 1999-08-31 | Norsk Hydro A.S. | Refining oil compositions |
| US6204401B1 (en) | 1997-01-28 | 2001-03-20 | Norsk Hydro Asa | Purifying polyunsaturated fatty acid glycerides |
| US6518049B1 (en) | 1999-02-17 | 2003-02-11 | Norsk Hydro Asa | Lipase-catalysed esterification of marine oil |
| US6528669B1 (en) | 1999-08-11 | 2003-03-04 | Norsk Hydro Asa | Recovery of polyunsaturated fatty acids from urea adducts |
| US6664405B2 (en) | 2000-11-30 | 2003-12-16 | Lipozen, Inc. | Method for isolating high-purified unsaturated fatty acids using crystallization |
| US7485323B2 (en) | 2005-05-31 | 2009-02-03 | Gelita Ag | Process for making a low molecular weight gelatine hydrolysate and gelatine hydrolysate compositions |
| US7491522B2 (en) | 2002-11-14 | 2009-02-17 | Pronova Biocare As | Lipase-catalysed esterification of marine oil |
| US7541480B2 (en) | 2003-11-19 | 2009-06-02 | Pro Aparts-Investimentos E Consultoria Lda | Process for the preparation of a composition comprising unsaturated compounds |
| US7550613B2 (en) | 2005-05-04 | 2009-06-23 | Pronova Biopharma Norge As | Compounds |
| US7553870B2 (en) | 2001-11-12 | 2009-06-30 | Pro Aparts Investimentos E Consultoria Lda | Use of polyunsaturated fatty acid for the primary prevention of major cardiovascular events |
| US7678930B2 (en) | 2002-07-11 | 2010-03-16 | Pronova Biopharma Norge As | Process for decreasing the amount of cholesterol in a marine oil using a volatile working fluid |
| US7709668B2 (en) | 2002-04-22 | 2010-05-04 | Industrial Research Limited | Separation technology |
| US7718698B2 (en) | 2002-07-11 | 2010-05-18 | Pronova Biopharma Norge As | Process for decreasing environmental pollutants in an oil or a fat |
| US20100160435A1 (en) | 2005-08-10 | 2010-06-24 | Tiberio Bruzzese | Composition of n-3 fatty acids having high concentration of epa and/or dha and containing n-6 fatty acids |
| US20110034555A1 (en) * | 2009-06-15 | 2011-02-10 | Amarin Pharma , Inc. | Compositions and methods for lowering triglycerides without raising ldl-c levels in a subject on concomitant statin therapy |
| US20110097394A1 (en) * | 2004-02-13 | 2011-04-28 | Jean-Pierre Sachetto | Type a gelatin capsule containing pufa in free acid form |
| US20110117180A1 (en) | 2007-01-10 | 2011-05-19 | Ocean Nutrition Canada Limited | Vegetarian microcapsules |
| US8003813B2 (en) | 2006-06-27 | 2011-08-23 | Pos Pilot Plant Corporation | Process for separating saturated and unsaturated fatty acids |
Family Cites Families (142)
| Publication number | Priority date | Publication date | Assignee | Title |
|---|---|---|---|---|
| JPS5735512A (en) | 1980-06-27 | 1982-02-26 | Nippon Oil & Fats Co Ltd | Preventive and remedy for thrombosis |
| BR8803255A (en) | 1981-11-10 | 1990-02-06 | Century Lab Inc | PROCESS OF EXTRACTION AND PURIFICATION OF POLYUNSATURATED FATTY ACIDS FROM NATURAL SOURCES |
| JPS59157018A (en) | 1983-02-27 | 1984-09-06 | Furointo Sangyo Kk | Novel oil-containing coated capsule pperaration |
| JPS59225115A (en) | 1983-06-06 | 1984-12-18 | Ota Seiyaku Kk | Microcapsule containing highly unsaturated long-chain fatty acid obtained from blue fish |
| JPS61126016A (en) | 1984-11-22 | 1986-06-13 | Toagosei Chem Ind Co Ltd | Microcapsule containing unsaturated fatty acid |
| EP0347509A1 (en) | 1988-06-21 | 1989-12-27 | Century Laboratories Inc. | A process of extraction and purification of polyunsaturated fatty acids from natural sources |
| EP0289204B1 (en) | 1987-04-27 | 1991-07-17 | Efamol Holdings Plc | Lithium salt-containing pharmaceutical compositions |
| IT1205043B (en) | 1987-05-28 | 1989-03-10 | Innova Di Ridolfi Flora & C S | PROCEDURE FOR THE EXTRACTION OF POLYUNSATURATED FATTY ACID ESTERS FROM FISH OILS AND PHARMACEUTICAL AND DIETARY COMPOSITIONS CONTAINING SUCH ESTERS |
| ZA885473B (en) | 1987-08-07 | 1989-03-29 | Century Lab Inc | Free fatty acids for treatment of diabetes mellitus |
| US4843095A (en) | 1987-08-07 | 1989-06-27 | Century Laboratories, Inc. | Free fatty acids for treatment or propyhlaxis of rheumatoid arthritis arthritis |
| GB2223943A (en) | 1988-10-21 | 1990-04-25 | Tillotts Pharma Ag | Oral disage forms of omega-3 polyunsaturated acids |
| EP0679057B1 (en) | 1993-01-15 | 1999-08-18 | Abbott Laboratories | Structured lipids |
| JPH0753356A (en) | 1993-08-16 | 1995-02-28 | Morishita Jintan Kk | Seamless capsule containing easily oxidizable oily substance and its production |
| WO1995009622A1 (en) | 1993-10-06 | 1995-04-13 | Peptide Technology Limited | Polyunsaturated fatty acids and uses thereof |
| US5494684A (en) | 1994-02-23 | 1996-02-27 | Bar-Ilan University | Plant protection from infection by Phytophthora infestans using fish oil |
| RU2127115C1 (en) | 1994-03-28 | 1999-03-10 | Владимир Константинович Гаврисюк | Polyunsaturated fatty acid mixture "omega-3" |
| JPH08100191A (en) * | 1994-09-30 | 1996-04-16 | Nisshin Flour Milling Co Ltd | Purification of highly unsaturated fatty acid or ester thereof |
| GB2300807B (en) | 1995-05-15 | 1999-08-18 | Tillotts Pharma Ag | Oral dosage forms of omega-3 polynunsaturated acids for the treatment of inflammatory bowel disease |
| WO1997039759A2 (en) | 1996-04-24 | 1997-10-30 | Brigham And Women's Hospital | Omega-3 fatty acids and omega-3 phosphatidylcholine in the treatment of bipolar disorder |
| US6077828A (en) | 1996-04-25 | 2000-06-20 | Abbott Laboratories | Method for the prevention and treatment of cachexia and anorexia |
| JPH1095744A (en) * | 1996-09-20 | 1998-04-14 | Nof Corp | Production of highly unsaturated aliphatic acid or its alkyl ester |
| EP0843972B1 (en) * | 1996-11-20 | 2002-07-31 | N.V. Nutricia | Nutritional composition comprising fats for the treatment of the metabolic syndrome |
| US6528699B1 (en) | 1997-02-25 | 2003-03-04 | Genzyme Transgenics Corporation | Transgenically produced non-secreted proteins |
| US6852870B2 (en) | 1999-03-22 | 2005-02-08 | Andrew Stoll | Omega-3 fatty acids in the treatment of depression |
| JP4761093B2 (en) | 1997-12-10 | 2011-08-31 | シクロスポリン セラポイティクス リミテッド | Pharmaceutical composition comprising omega-3 fatty acid oil |
| US7112609B2 (en) | 1999-06-01 | 2006-09-26 | Drugtech Corporation | Nutritional supplements |
| JP2001054396A (en) | 1999-06-08 | 2001-02-27 | Nippon Suisan Kaisha Ltd | Production of oil and fat containing highly unsaturated fatty acid using lipase |
| AU5319499A (en) | 1999-07-22 | 2001-02-13 | Ivan L. Cameron | Fatty acids to minimize cancer therapy side effects |
| EP1211955A1 (en) | 1999-08-30 | 2002-06-12 | Ocean Nutrition Canada Ltd. | A nutritional supplement for lowering serum triglyceride and cholesterol levels |
| DE60045101D1 (en) | 1999-08-31 | 2010-11-25 | Chugai Pharmaceutical Co Ltd | CAPSULES |
| EP1106072B1 (en) | 1999-12-10 | 2005-11-30 | Loders Croklaan B.V. | Palmitoleic acid and its use in foods |
| AU2634101A (en) | 2000-01-06 | 2001-07-16 | Martek Biosciences Corporation | Therapeutic preparations of highly unsaturated fatty acids |
| DK1157692T3 (en) | 2000-05-22 | 2006-02-06 | Pro Aparts Investimentos E Con | Composition of fatty acids containing at least 80% by weight of EPA and DHA, derivatives thereof and pharmaceutical use thereof |
| GB0016045D0 (en) | 2000-06-29 | 2000-08-23 | Laxdale Limited | Therapeutic combinations of fatty acids |
| GB0016452D0 (en) | 2000-07-04 | 2000-08-23 | Kilgowan Limited | Vitamin K and essential fatty acids |
| EP1178103A1 (en) | 2000-08-02 | 2002-02-06 | Dsm N.V. | Purifying crude pufa oils |
| EP1997498B1 (en) | 2001-06-18 | 2012-04-25 | Neptune Technologies & Bioressources Inc. | Krill extracts for prevention and/or treatment of cardiovascular diseases |
| CN1197564C (en) * | 2001-09-30 | 2005-04-20 | 中国药品生物制品检定所 | Application of fur seal oil in preparation of medicine for treating lipometabolism disorder (high blood fat) |
| GB2385852A (en) | 2002-02-27 | 2003-09-03 | Rothamsted Ex Station | Delta 6-desaturases from Primulaceae |
| WO2003082339A1 (en) | 2002-03-22 | 2003-10-09 | Doc's Guide, Inc. | Multivitamin and mineral nutritional supplement |
| DE10214005A1 (en) | 2002-03-27 | 2003-10-09 | Volker Bartz | Orally administered dietetic, nutritional supplement or medicament composition, useful as hypolipemic agent, comprising mixture of pectin and/or guar powder with eicosapentaenoic and docosahexaenoic acids |
| ITMI20020731A1 (en) | 2002-04-08 | 2003-10-08 | Ibsa Inst Biochimique Sa | PHARMACEUTICAL COMPOSITIONS FOR ACETYLSALICYLIC ACID AND OMEGA-3 OILS |
| US8017651B2 (en) | 2002-11-22 | 2011-09-13 | Bionexus, Ltd. | Compositions and methods for the treatment of HIV-associated fat maldistribution and hyperlipidemia |
| WO2004056370A1 (en) | 2002-12-20 | 2004-07-08 | Pronova Biocare As | Use of a fatty acid composition for treatment of male infertility |
| WO2004098311A1 (en) | 2003-05-05 | 2004-11-18 | Denofa As | Fish oils with an altered fatty acid profile, method of producing same and their use |
| US6846942B2 (en) | 2003-05-20 | 2005-01-25 | David Rubin | Method for preparing pure EPA and pure DHA |
| PT1645617E (en) | 2003-07-09 | 2010-05-03 | J Oil Mills Inc | Antioxidant fat or oil composition containing long-chain highly unsaturated fatty acid |
| US7759507B2 (en) | 2003-09-05 | 2010-07-20 | Abbott Laboratories | Lipid system and methods of use |
| SE0303513D0 (en) | 2003-12-19 | 2003-12-19 | Pronova Biocare As | Use of a fatty acid composition comprising at least one of epa and any or any combination thereof |
| GB0413729D0 (en) | 2004-06-18 | 2004-07-21 | Tillotts Pharma Ag | A pharmaceutical composition and its use |
| GB0413730D0 (en) | 2004-06-18 | 2004-07-21 | Tillotts Pharma Ag | A pharmaceutical composition and its use |
| US20070265341A1 (en) | 2004-07-01 | 2007-11-15 | The Schepens Eye Research Institute Inc. | Compositions and methods for treating eye disorders and conditions |
| US20080193549A1 (en) | 2004-07-05 | 2008-08-14 | Otago Innovation Limited | Hoki Fish Liver Oil, Fractions Thereof And Therapeutic Uses |
| RU2388490C2 (en) | 2004-07-19 | 2010-05-10 | Тиа Медика Ас | Composition containing vegetable or cod-liver oil and compounds which contain non-oxidising structural elements of fatty acids |
| WO2006009465A2 (en) | 2004-07-19 | 2006-01-26 | Thia Medica As | Composition comprising protein material and non-oxidizable fatty acid entities |
| WO2007130713A1 (en) | 2006-02-01 | 2007-11-15 | Transform Pharmaceuticals, Inc. | Novel fenofibrate formulations and related methods of treatment |
| CA2576196A1 (en) | 2004-08-06 | 2006-02-16 | Transform Pharmaceuticals, Inc. | Novel statin pharmaceutical compositions and related methods of treatment |
| WO2007130714A1 (en) | 2006-02-01 | 2007-11-15 | Transform Pharmaceuticals, Inc. | Novel statin pharmaceutical compositions and related methods of treatment |
| BRPI0513082A (en) | 2004-08-06 | 2008-04-22 | Transform Pharmaceuticals Inc | fenofibrate formulations and related treatment methods |
| EP1791544A4 (en) | 2004-09-08 | 2007-09-12 | Chelsea Therapeutics Inc | Quinazoline derivatives as metabolically inert antifolate compounds |
| US20060088596A1 (en) | 2004-09-28 | 2006-04-27 | Atrium Medical Corporation | Solubilizing a drug for use in a coating |
| US20070191467A1 (en) * | 2004-12-06 | 2007-08-16 | Reliant Pharmaceutical, Inc. | Statin and omega-3 fatty acids for lipid therapy |
| DE102004062141A1 (en) | 2004-12-23 | 2006-07-06 | Nutrinova Nutrition Specialties & Food Ingredients Gmbh | Process for the preparation of a crude oil from mixtures of microorganisms and plants, the oil thus produced and the specific uses of the thus prepared and optionally additionally refined oil |
| JP5503846B2 (en) | 2005-01-24 | 2014-05-28 | プロノヴァ・バイオファーマ・ノルゲ・アーエス | Use of a fatty acid composition containing DHA in the manufacture of a medical or food product for the treatment of amyloidosis-related diseases |
| EP1858352B1 (en) | 2005-02-18 | 2013-06-05 | Delante Health AS | A composition comprising a powder containing microencapsulated polyunsaturated long-chain esterified fatty acids distributed in an effervescent base |
| EA200701913A1 (en) | 2005-03-08 | 2008-08-29 | Релайэнт Фармасьютикалз, Инк. | TREATMENT WITH STATIN, OMEGA-3 FATTY ACIDS AND THEIR COMBINED PRODUCT |
| DE102005013779A1 (en) | 2005-03-22 | 2006-09-28 | Basf Plant Science Gmbh | Process for the preparation of polyunsaturated C20 and C22 fatty acids having at least four double bonds in transgenic plants |
| WO2006102896A2 (en) | 2005-03-29 | 2006-10-05 | Aalborg Universitet | A process to concentrate ω3-pufa from fish oil by selective hydrolysis using cutinase immobilized on zeolite nay |
| KR100539357B1 (en) | 2005-04-11 | 2005-12-28 | 동부한농화학 주식회사 | A process for the preparation of unsaturated fatty acid |
| CA2614095A1 (en) | 2005-07-01 | 2007-01-11 | Martek Biosciences Corporation | Polyunsaturated fatty acid-containing oil product and uses and production thereof |
| US20070020340A1 (en) | 2005-07-25 | 2007-01-25 | David Rubin | Fish oil products for reducing cholesterol, low density lipoprotein, and hypertension |
| CN101500555A (en) | 2005-08-04 | 2009-08-05 | 变换药品公司 | Novel formulations comprising fenofibrate and a statin, and related methods of treatment |
| US20070134493A1 (en) | 2005-12-08 | 2007-06-14 | Kanji Meghpara | Compositions and capsules with stable hydrophilic layers |
| WO2007075841A1 (en) | 2005-12-20 | 2007-07-05 | Cenestra, Llc | Omega 3 fatty acid formulations |
| FR2896172B1 (en) | 2006-01-17 | 2008-10-10 | Polaris Soc Par Actions Simpli | NOVEL METHOD FOR STABILIZING POLYUNSATURATED FATTY ACIDS AND THE COMPOSITIONS THUS OBTAINED |
| AR059376A1 (en) | 2006-02-21 | 2008-03-26 | Basf Plant Science Gmbh | PROCEDURE FOR THE PRODUCTION OF POLYINSATURATED FATTY ACIDS |
| DE102006008030A1 (en) | 2006-02-21 | 2007-08-23 | Basf Plant Science Gmbh | Preparation of polyunsaturated fatty acids in transgenic plants, useful e.g. for reducing risk of hypertension and heart disease, includes expressing a codon-optimized sequence for delta5-elongase |
| WO2007128801A1 (en) | 2006-05-08 | 2007-11-15 | Novartis Ag | Combination of organic compounds |
| KR100684641B1 (en) | 2006-07-25 | 2007-02-22 | 주식회사 일신웰스 | Oil composition, food and health food containing the same |
| WO2008012329A2 (en) | 2006-07-28 | 2008-01-31 | V. Mane Fils | Seamless capsules containing high amounts of polyunsaturated fatty acids and a flavouring component |
| KR100758664B1 (en) | 2006-08-16 | 2007-09-13 | (주)케비젠 | The method of preparing a microcapsule containing unsaturated fatty acids, the microcapsule prepared by the method, and articles containing the microcapsule |
| CN101194913A (en) * | 2006-12-05 | 2008-06-11 | 张金生 | Natural seal oil compression biological preparation for treating hyperlipidemia and technique of preparing the same |
| WO2008088808A1 (en) | 2007-01-16 | 2008-07-24 | Reliant Pharmaceuticals, Inc. | Treatment with non-steroidal anti-inflammatory drugs and omega-3 fatty acids, and a combination product thereof |
| CN101663031A (en) | 2007-02-20 | 2010-03-03 | 马泰克生物科学公司 | Oxylipins from long chain polyunsaturated fatty acids and methods of making and using the same |
| WO2008113177A1 (en) | 2007-03-20 | 2008-09-25 | Centre De Recherche Sur Les Biotechnologies Marines | Compositions comprising polyunsaturated fatty acid monoglycerides or derivatives thereof and uses thereof |
| WO2008133573A1 (en) | 2007-04-26 | 2008-11-06 | Patrick Adlercreutz | A polyunsaturated fatty acid (pufa) enriched marine oil comprising eicosapentaenoic acid (epa) and docosahexaenoic acid (dha), and a process of production thereof |
| WO2009009040A2 (en) | 2007-07-06 | 2009-01-15 | Baum Seth J | Fatty acid compositions and methods of use |
| CL2008002020A1 (en) | 2007-07-12 | 2008-11-14 | Ocean Nutrition Canada Ltd | Method of modifying an oil, which comprises hydrolyzing glycerides with a solution of thermomyces lanuginosus lipase, separating the saturated fatty acid fraction from the hydrolyzed glyceride fraction and esterifying the hydrolyzed glycerides in the presence of candida antarctica lipase b; and oil composition. |
| CA2694054C (en) | 2007-07-25 | 2015-11-17 | Epax As | Omega-3 fatty acid fortified composition |
| CA2693070A1 (en) | 2007-07-30 | 2009-02-05 | Nippon Suisan Kaisha, Ltd. | Method for producing epa-enriched oil and dha-enriched oil |
| WO2009020406A1 (en) | 2007-08-07 | 2009-02-12 | Granate Seed Limited | Methods of making lipid substances, lipid substances made thereby and uses thereof |
| JPWO2009028457A1 (en) | 2007-08-29 | 2010-12-02 | 国立大学法人信州大学 | Non-alcoholic steatohepatitis drug |
| DE102007055344A1 (en) | 2007-11-19 | 2009-05-20 | K. D. Pharma Bexbach Gmbh | New use of omega-3 fatty acid (s) |
| NZ600721A (en) | 2008-01-10 | 2013-03-28 | Takeda Pharmaceutical | Capsule formulation |
| US20090182049A1 (en) | 2008-01-16 | 2009-07-16 | Joar Arild Opheim | Pharmaceutical Composition and Method for Treating Hypertriglyceridemia and Hypercholesterolemia in Humans |
| US8829215B2 (en) | 2008-05-15 | 2014-09-09 | Pronova Biopharma Norge As | Krill oil process |
| EP3578177A1 (en) | 2008-09-02 | 2019-12-11 | Amarin Pharmaceuticals Ireland Limited | Pharmaceutical composition comprising eicosapentaenoic acid and nicotinic acid and methods of using same |
| US20100062057A1 (en) | 2008-09-10 | 2010-03-11 | Pronova BioPharma Norge AS. | Formulation |
| DK2337857T3 (en) | 2008-10-02 | 2017-05-22 | Ramon Nieves Gonzalez | MICROALGE EXTRACT CONTAINING POLYUM Saturated W3 FAT ACIDS AND PROCEDURE FOR EXTRACING OIL FROM MICRO-ORGANISMS |
| JP6113954B2 (en) | 2008-10-31 | 2017-04-12 | リピッド ファーマシューティカルズ イーエイチエフ. | Fatty acids for use as pharmaceuticals |
| PL2395991T3 (en) | 2009-02-10 | 2013-11-29 | Amarin Pharmaceuticals Ie Ltd | Use of eicosapentaenoic acid ethyl ester for treating hypertriglyceridemia |
| CN101822651A (en) * | 2009-03-05 | 2010-09-08 | Dpa工业公司 | Chewable capsule and preparation method thereof |
| CA2754860C (en) | 2009-03-09 | 2020-02-25 | Pronova Biopharma Norge As | Compositions comprising a fatty acid oil mixture and a surfactant, and methods and uses thereof |
| AU2009344374B2 (en) | 2009-04-17 | 2015-07-23 | Natac Pharma S.L. | Compositions rich in omega-3 fatty acids with a low content in phytanic acid |
| WO2010127103A1 (en) | 2009-04-29 | 2010-11-04 | Amarin Pharma, Inc. | Stable pharmaceutical composition and methods of using same |
| CN106822080A (en) | 2009-04-29 | 2017-06-13 | 阿马里纳药物爱尔兰有限公司 | Pharmaceutical composition containing EPA and cardiovascular agents and use its method |
| BRPI1009920A2 (en) | 2009-05-01 | 2016-03-15 | Micropharma Ltd | bacterial compositions for prophylaxine and treatment of degenerative disease. |
| EP2473045B1 (en) | 2009-09-01 | 2016-08-17 | Catabasis Pharmaceuticals, Inc. | Fatty acid niacin conjugates and their uses |
| WO2011038122A1 (en) | 2009-09-23 | 2011-03-31 | Amarin Corporation Plc | Pharmaceutical composition comprising omega-3 fatty acid and hydroxy-derivative of a statin and methods of using same |
| CA2781525C (en) | 2009-10-23 | 2020-05-12 | Pronova Biopharma Norge As | Coated capsules and tablets of a fatty acid oil mixture |
| RU2009145010A (en) | 2009-12-04 | 2011-06-20 | Общество с ограниченной ответственностью (ООО) "Аббифарм" (RU) | COMPOSITION OMEGA-3 AND OMEGA-6 POLYUNSATURATED FATTY ACIDS |
| WO2011095284A1 (en) | 2010-02-02 | 2011-08-11 | Cognis Ip Management Gmbh | Enrichment of polyunsaturated fatty acids |
| GB201006204D0 (en) | 2010-04-14 | 2010-06-02 | Ayanda As | Composition |
| WO2011133610A1 (en) | 2010-04-22 | 2011-10-27 | E. I. Du Pont De Nemours And Company | Method for obtaining polyunsaturated fatty acid-containing compositions from microbial biomass |
| WO2011161702A1 (en) | 2010-06-25 | 2011-12-29 | Epax As | Process for separating polyunsaturated fatty acids from long chain unsaturated or less saturated fatty acids |
| WO2012032415A2 (en) | 2010-09-08 | 2012-03-15 | Pronova Biopharma Norge As | Compositions comprising a fatty acid oil mixture comprising epa and dha in free acid form, a surfactant, and a statin |
| EP2619298B1 (en) | 2010-09-24 | 2018-09-12 | Pronova BioPharma Norge AS | Process for concentrating omega-3 fatty acids |
| WO2012083034A1 (en) | 2010-12-15 | 2012-06-21 | Louis Sanfilippo | Modulation of neurotrophic factors by omega-3 fatty acid formulations |
| WO2012087153A1 (en) | 2010-12-23 | 2012-06-28 | Marine Bioproducts As | Enrichment of marine oils with omega-3 polyunsaturated fatty acids by lipase-catalysed hydrolysis |
| EP2476425B1 (en) | 2011-01-14 | 2014-03-19 | Visiotact Pharma | Composition comprising OPC and Omega-3 for preventing and/or inhibiting the development of diabetic retinopathy |
| JP2014505732A (en) | 2011-02-16 | 2014-03-06 | ピヴォタル セラピューティクス インコーポレイテッド | Statins and omega-3 fatty acids (EPA, DHA and DPA) for use in cardiovascular disease |
| CA2827577A1 (en) | 2011-02-16 | 2012-08-23 | Pivotal Therapeutics, Inc. | A formulations comprising omega 3 fatty acids and an anti obesity agent for the reduction of body weight in cardiovascular disease patients (cvd) and diabetics |
| EP2675442A1 (en) * | 2011-02-16 | 2013-12-25 | Pivotal Therapeutics, Inc. | Cholesterol absorption inhibitor (azetidinone) and omega 3 fatty acids (epa, dha, dpa) for the reduction of cholesterol and for the reduction of cardiovascular events |
| JP2014506891A (en) * | 2011-02-16 | 2014-03-20 | ピヴォタル セラピューティクス インコーポレイテッド | Ω3 fatty acid diagnostic assay for dietary management of patients with cardiovascular disease (CVD) |
| EP2675446A1 (en) * | 2011-02-16 | 2013-12-25 | Pivotal Therapeutics, Inc. | Omega 3 formulations comprising epa, dha and dpa for treatment of risk factors for cardiovascular disease |
| WO2012112902A1 (en) | 2011-02-18 | 2012-08-23 | Martek Biosciences Corporation | Methods of preparing free polyunsaturated fatty acids |
| US20140051877A1 (en) | 2011-04-28 | 2014-02-20 | Nandakishore Jeevanrao Duragkar | Eicosapentaenoic acid (epa) as polyunsaturated free fatty acid in its directly compressible powder form and process of isolation thereof |
| CN102311868B (en) | 2011-04-29 | 2017-05-24 | 塞拉斯有限责任公司 | Method for extracting krill oil rich in phospholipids and neutral lipid without using solvent |
| US8697676B2 (en) | 2011-06-15 | 2014-04-15 | Ronald E Rosedale | Omega-3 fatty acid nutriceutical composition and optimization method |
| US20130095179A1 (en) | 2011-09-15 | 2013-04-18 | Omthera Pharmaceuticals, Inc. | Methods and compositions for treating, reversing, inhibiting or preventing resistance to antiplatelet therapy |
| US20140316003A1 (en) | 2011-10-21 | 2014-10-23 | Omthera Pharmaceuticals, Inc. | Methods and compositions for treating or preventing attention deficit hyperactivity disorder |
| WO2013063067A1 (en) * | 2011-10-24 | 2013-05-02 | Stable Solutions Llc | Enriched injectable emulsion containing selected fatty acid triglycerides |
| RU2018116572A (en) | 2012-01-06 | 2018-10-23 | Омтера Фармасьютикалс, Инк. | DPA Enriched Omega-3 Polyunsaturated Fatty Acids Free Acid Formulations |
| IN2014DN08449A (en) | 2012-03-30 | 2015-05-08 | Sancilio & Company Inc | |
| US20130295173A1 (en) | 2012-05-07 | 2013-11-07 | Omthera Pharmaceuticals, Inc. | Compositions of statins and omega-3 fatty acids |
| EP2861227A4 (en) | 2012-06-17 | 2016-01-27 | Matinas Biopharma Inc | Omega-3 pentaenoic acid compositions and methods of use |
| US20140194512A1 (en) | 2012-06-17 | 2014-07-10 | Matinas Biopharma, Inc. | Compositions comprising docosapentaenoic acid and methods of use |
| GB201216385D0 (en) | 2012-09-13 | 2012-10-31 | Chrysalis Pharma Ag | A pharmaceutical composition |
| WO2016069446A1 (en) | 2014-10-28 | 2016-05-06 | Omthera Pharmaceuticals Inc | Methods for modulating plasma levels of lipoproteins |
| WO2016073335A1 (en) | 2014-11-05 | 2016-05-12 | Omthera Pharmaceuticals Inc. | Methods of treatment |
| WO2016130417A1 (en) | 2015-02-11 | 2016-08-18 | Omthera Pharmaceuticals Inc | Omega-3 fatty acid prodrug compounds and uses thereof |
| MA41611A (en) | 2015-02-23 | 2018-01-02 | Omthera Pharmaceuticals Inc | MILLI-CAPSULE PREPARATIONS CONTAINING FREE POLYINSATURATED FATTY ACIDS |
-
2013
- 2013-01-04 RU RU2018116572A patent/RU2018116572A/en not_active Application Discontinuation
- 2013-01-04 CN CN201611034149.7A patent/CN107050457A/en active Pending
- 2013-01-04 US US14/370,730 patent/US20150004224A1/en not_active Abandoned
- 2013-01-04 MX MX2014008309A patent/MX358319B/en active IP Right Grant
- 2013-01-04 HU HUE13733671A patent/HUE039659T2/en unknown
- 2013-01-04 KR KR1020147021557A patent/KR102153143B1/en active IP Right Grant
- 2013-01-04 PL PL13733671T patent/PL2800563T3/en unknown
- 2013-01-04 US US13/734,846 patent/US9050308B2/en not_active Expired - Fee Related
- 2013-01-04 SI SI201331151T patent/SI2800563T1/en unknown
- 2013-01-04 SG SG11201403805WA patent/SG11201403805WA/en unknown
- 2013-01-04 NZ NZ626699A patent/NZ626699A/en not_active IP Right Cessation
- 2013-01-04 LT LTEP13733671.5T patent/LT2800563T/en unknown
- 2013-01-04 CA CA2860512A patent/CA2860512C/en not_active Expired - Fee Related
- 2013-01-04 EP EP13733671.5A patent/EP2800563B1/en active Active
- 2013-01-04 EP EP18158463.2A patent/EP3348262A1/en not_active Withdrawn
- 2013-01-04 IN IN6125DEN2014 patent/IN2014DN06125A/en unknown
- 2013-01-04 KR KR1020197029482A patent/KR102153245B1/en active IP Right Grant
- 2013-01-04 ES ES13733671.5T patent/ES2685703T3/en active Active
- 2013-01-04 SG SG10201701004RA patent/SG10201701004RA/en unknown
- 2013-01-04 BR BR112014016788A patent/BR112014016788A8/en not_active IP Right Cessation
- 2013-01-04 CN CN201380012754.2A patent/CN104321055A/en active Pending
- 2013-01-04 CN CN201810809253.1A patent/CN108524483A/en active Pending
- 2013-01-04 UA UAA201407804A patent/UA114615C2/en unknown
- 2013-01-04 PT PT13733671T patent/PT2800563T/en unknown
- 2013-01-04 DK DK13733671.5T patent/DK2800563T3/en active
- 2013-01-04 JP JP2014551376A patent/JP6399655B2/en not_active Expired - Fee Related
- 2013-01-04 RU RU2014128500A patent/RU2664429C2/en active
- 2013-01-04 WO PCT/US2013/020398 patent/WO2013103902A1/en active Application Filing
- 2013-01-04 MY MYPI2014002018A patent/MY165048A/en unknown
- 2013-01-04 RS RS20181033A patent/RS57777B1/en unknown
- 2013-01-04 PE PE2014001081A patent/PE20142459A1/en active IP Right Grant
- 2013-03-12 US US13/797,557 patent/US9050309B2/en not_active Expired - Fee Related
-
2014
- 2014-07-03 IL IL233517A patent/IL233517A/en active IP Right Grant
- 2014-07-04 PH PH12014501553A patent/PH12014501553B1/en unknown
- 2014-07-07 DO DO2014000159A patent/DOP2014000159A/en unknown
- 2014-07-07 CL CL2014001803A patent/CL2014001803A1/en unknown
- 2014-08-05 CO CO14170543A patent/CO7061070A2/en unknown
- 2014-08-05 ZA ZA2014/05765A patent/ZA201405765B/en unknown
- 2014-08-05 EC ECIEPI201412527A patent/ECSP14012527A/en unknown
-
2015
- 2015-03-17 HK HK18110835.8A patent/HK1251457A1/en unknown
- 2015-03-17 HK HK15102685.9A patent/HK1202073A1/en not_active IP Right Cessation
- 2015-04-29 US US14/699,556 patent/US10117844B2/en not_active Expired - Fee Related
- 2015-10-06 PH PH12015502307A patent/PH12015502307A1/en unknown
-
2017
- 2017-05-03 IL IL252084A patent/IL252084B/en active IP Right Grant
- 2017-06-23 JP JP2017123521A patent/JP6626857B2/en not_active Expired - Fee Related
-
2018
- 2018-09-05 HR HRP20181418TT patent/HRP20181418T1/en unknown
- 2018-09-06 CY CY181100930T patent/CY1120663T1/en unknown
- 2018-10-03 US US16/150,363 patent/US20190029985A1/en not_active Abandoned
-
2019
- 2019-04-24 IL IL266231A patent/IL266231B/en not_active IP Right Cessation
- 2019-11-29 JP JP2019217081A patent/JP2020045358A/en not_active Ceased
Patent Citations (33)
| Publication number | Priority date | Publication date | Assignee | Title |
|---|---|---|---|---|
| US4377526A (en) | 1981-05-15 | 1983-03-22 | Nippon Suisan Kaisha, Ltd. | Method of purifying eicosapentaenoic acid and its esters |
| US5106542A (en) | 1986-12-17 | 1992-04-21 | Nestec S.A. | Process for the continuous fractionation of a mixture of fatty acids |
| US5243046A (en) | 1986-12-17 | 1993-09-07 | Nestec S.A. | Process for the continuous fractionation of a mixture of fatty acids |
| US5502077A (en) | 1988-08-11 | 1996-03-26 | Norsk Hydro A.S. | Fatty acid composition |
| US5656667A (en) | 1988-08-11 | 1997-08-12 | Norsk Hydro As | Fatty acid composition |
| US5472705A (en) | 1992-08-11 | 1995-12-05 | Prospa B.V. | Pharmaceutical composition containing esters of ω-3 polyunsaturated acids and their use in the topical treatment of morbid affections |
| US5719302A (en) | 1993-04-29 | 1998-02-17 | Pronova A.S | Processes for chromatographic fractionation of fatty acids and their derivatives |
| US5750572A (en) | 1993-12-14 | 1998-05-12 | Prospa B.V. | Salts of a polyunsaturated fatty acid and pharmaceutical formulations containing them |
| US5945318A (en) | 1994-03-08 | 1999-08-31 | Norsk Hydro A.S. | Refining oil compositions |
| US5679809A (en) | 1994-05-09 | 1997-10-21 | Nestec S.A. | Concentrate of polyunsaturated fatty acid ethyl esters and preparation thereof |
| US5776978A (en) | 1994-08-25 | 1998-07-07 | Prospa B.V. | Pharmaceutical preparations containing polyunsaturated fatty acids, their esters or salts, together with antioxidant vitamins or provitamins |
| US5869714A (en) | 1994-10-20 | 1999-02-09 | Prospa B.V. | Salts of omega-3-polyunsaturated fatty acids and pharmaceutical formulations containing them |
| US5792795A (en) | 1995-05-15 | 1998-08-11 | Tillotts Pharma Ag | Treatment of inflammatory bowel disease using oral dosage forms of omega-3 polyunsaturated acids |
| US5948818A (en) | 1995-05-15 | 1999-09-07 | Tillotts Pharma Ag | Treatment of inflammatory bowel disease using oral dosage forms of omega-3 polyunsaturated acids |
| US6204401B1 (en) | 1997-01-28 | 2001-03-20 | Norsk Hydro Asa | Purifying polyunsaturated fatty acid glycerides |
| US6518049B1 (en) | 1999-02-17 | 2003-02-11 | Norsk Hydro Asa | Lipase-catalysed esterification of marine oil |
| US6528669B1 (en) | 1999-08-11 | 2003-03-04 | Norsk Hydro Asa | Recovery of polyunsaturated fatty acids from urea adducts |
| US6664405B2 (en) | 2000-11-30 | 2003-12-16 | Lipozen, Inc. | Method for isolating high-purified unsaturated fatty acids using crystallization |
| US7553870B2 (en) | 2001-11-12 | 2009-06-30 | Pro Aparts Investimentos E Consultoria Lda | Use of polyunsaturated fatty acid for the primary prevention of major cardiovascular events |
| US7619002B2 (en) | 2001-11-12 | 2009-11-17 | Pro Aparts Investimentos E Consultoria LDA. AV. Arriaga | Use of polyunsaturated fatty acids for the primary prevention of major cardiovascular events |
| US7709668B2 (en) | 2002-04-22 | 2010-05-04 | Industrial Research Limited | Separation technology |
| US7732488B2 (en) | 2002-07-11 | 2010-06-08 | Pronova Biopharma Norge As | Pharmaceutical composition comprising low concentrations of environmental pollutants |
| US7678930B2 (en) | 2002-07-11 | 2010-03-16 | Pronova Biopharma Norge As | Process for decreasing the amount of cholesterol in a marine oil using a volatile working fluid |
| US7718698B2 (en) | 2002-07-11 | 2010-05-18 | Pronova Biopharma Norge As | Process for decreasing environmental pollutants in an oil or a fat |
| US7491522B2 (en) | 2002-11-14 | 2009-02-17 | Pronova Biocare As | Lipase-catalysed esterification of marine oil |
| US7541480B2 (en) | 2003-11-19 | 2009-06-02 | Pro Aparts-Investimentos E Consultoria Lda | Process for the preparation of a composition comprising unsaturated compounds |
| US20110097394A1 (en) * | 2004-02-13 | 2011-04-28 | Jean-Pierre Sachetto | Type a gelatin capsule containing pufa in free acid form |
| US7550613B2 (en) | 2005-05-04 | 2009-06-23 | Pronova Biopharma Norge As | Compounds |
| US7485323B2 (en) | 2005-05-31 | 2009-02-03 | Gelita Ag | Process for making a low molecular weight gelatine hydrolysate and gelatine hydrolysate compositions |
| US20100160435A1 (en) | 2005-08-10 | 2010-06-24 | Tiberio Bruzzese | Composition of n-3 fatty acids having high concentration of epa and/or dha and containing n-6 fatty acids |
| US8003813B2 (en) | 2006-06-27 | 2011-08-23 | Pos Pilot Plant Corporation | Process for separating saturated and unsaturated fatty acids |
| US20110117180A1 (en) | 2007-01-10 | 2011-05-19 | Ocean Nutrition Canada Limited | Vegetarian microcapsules |
| US20110034555A1 (en) * | 2009-06-15 | 2011-02-10 | Amarin Pharma , Inc. | Compositions and methods for lowering triglycerides without raising ldl-c levels in a subject on concomitant statin therapy |
Non-Patent Citations (18)
| Title |
|---|
| BELLUZZI ET AL., DIG. DIS. SCI., vol. 39, no. 12, 1994, pages 2589 - 2594 |
| DAVIDSON ET AL., J. CLIN. LIPIDOLOGY, vol. 3, no. 5, 2009, pages 332 - 340 |
| FOJO; BREWER, J. OF INT. MED., vol. 231, 1992, pages 669 - 677 |
| GRIMSGAARD ET AL., AM. J. CLIN. NUTR., vol. 66, 1997, pages 649 - 659 |
| HAYES ET AL.: "Triangular Phase Diagrams To Predict The Fractionation Of Free Fatty Acid Mixtures Via Urea Complex Formation", SEPARATION SCI. TECHNOL., vol. 36, no. 1, 2001, pages 45 - 58 |
| HAYES: "Handbook of Functional Lipids", 2005, TAYLOR & FRANCIS GROUP |
| HOMMA ET AL., ATHEROSCLEROSIS, vol. 91, no. 1, 1991, pages 145 - 153 |
| KAUR ET AL., PROG. LIPID RES., vol. 50, 2011, pages 28 - 34 |
| KAUR ET AL.: "Docosapentaenoic acid (22:5n-3): a review of its biological effects", PROG. LIPID RES., vol. 50, 2011, pages 28 - 34, XP027576322 |
| KELLEY ET AL., J. NUTRITION, vol. 139, no. 3, 2009, pages 495 - 501 |
| LAWSON ET AL., BIOCHEM BIOPHYS RES COMMUN., vol. 156, 1988, pages 960 - 963 |
| LAWSON ET AL.: "Human absorption of fish oil fatty acids as triacylglycerols, free acids, or ethyl esters", BIOCHEM BIOPHYS RES COMMUN., vol. 152, 1988, pages 328 - 335, XP055316822, DOI: doi:10.1016/S0006-291X(88)80718-6 |
| LIU ET AL.: "Concentration of docosahexaenoic acid (DHA) and eicosapentaenoic acid (EPA) of tuna oil by urea complexation: optimization of process parameters", JOURNAL OF FOOD ENGINEERING, vol. 73, 2006, pages 203 - 209, XP027890873, Retrieved from the Internet <URL:researchgate.net> [retrieved on 20130227] * |
| MORI ET AL., AM. J. CLIN. NUTR., vol. 71, 2000, pages 1085 - 1094 |
| NAKAMUA; MAEGAWA, ENDOCRINE ABSTRACTS, 2012 |
| NOZUE ET AL., AM J CARDIOL., vol. 111, no. 1, 1 January 2013 (2013-01-01), pages 6 - 11 |
| OLIVA ET AL.: "Inherited Apolipoprotein A-V Deficiency in Severe Hypertriglyceridemia", ARTERIOSCLER THROMB VASC BIOL., vol. 25, 2005, pages 411 - 417, XP055080293, Retrieved from the Internet <URL:http://atvb.ahajournals.org/.> [retrieved on 20130227] * |
| See also references of EP2800563A4 |
Cited By (27)
| Publication number | Priority date | Publication date | Assignee | Title |
|---|---|---|---|---|
| US10328046B2 (en) | 2009-04-29 | 2019-06-25 | Ds Biopharma Limited | Topical compositions comprising polyunsaturated fatty acids |
| US10918614B2 (en) | 2009-04-29 | 2021-02-16 | Ds Biopharma Limited | Topical compositions comprising polyunsaturated fatty acids |
| US10117844B2 (en) | 2012-01-06 | 2018-11-06 | Omthera Pharmaceuticals, Inc. | DPA-enriched compositions of omega-3 polyunsaturated fatty acids in free acid form |
| US9492545B2 (en) | 2012-05-07 | 2016-11-15 | Omthera Pharmaceuticals Inc. | Compositions of statins and omega-3 fatty acids |
| JP2015528475A (en) * | 2012-09-13 | 2015-09-28 | クリサリス・ファーマ・アーゲー | Pharmaceutical composition |
| WO2014040921A1 (en) * | 2012-09-13 | 2014-03-20 | Chrysalis Pharma Ag | A pharmaceutical composition |
| AU2018202316B2 (en) * | 2012-09-13 | 2019-10-31 | Chrysalis Pharma Ag | A pharmaceutical composition |
| AU2013314453B2 (en) * | 2012-09-13 | 2018-01-04 | Chrysalis Pharma Ag | A pharmaceutical composition |
| US10314789B2 (en) | 2012-09-13 | 2019-06-11 | Chrysalis Pharma Ag | Soft gelatin encapsulated pharmaceutical composition of cis-5,8,11,14,17-eicosapentaenoic acid in free acid form and cis-7,10,13,16,19-docosapentaenoic acid in free acid form |
| WO2014063190A1 (en) * | 2012-10-23 | 2014-05-01 | Deakin University | Method for reducing triglycerides |
| WO2015011724A2 (en) | 2013-07-22 | 2015-01-29 | Kms Health Center Pvt Ltd | A novel omega -3 fatty acid composition with a plant extract |
| WO2015024055A1 (en) * | 2013-08-20 | 2015-02-26 | Deakin University | Separation of omega-3 fatty acids |
| US9505709B2 (en) | 2014-05-05 | 2016-11-29 | Thetis Pharmaceuticals Llc | Compositions and methods relating to ionic salts of peptides |
| US10105333B2 (en) | 2014-06-04 | 2018-10-23 | Ds Biopharma Limited | Pharmaceutical compositions comprising DGLA and use of same |
| US10849870B2 (en) | 2014-06-04 | 2020-12-01 | Ds Biopharma Limited | Pharmaceutical compositions comprising DGLA and use of same |
| US10537543B2 (en) | 2014-06-04 | 2020-01-21 | Ds Biopharma Limited | Pharmaceutical compositions comprising DGLA and use of same |
| US11478442B2 (en) | 2014-06-04 | 2022-10-25 | Ds Biopharma Limited | Pharmaceutical compositions comprising DGLA and use of same |
| US9999626B2 (en) | 2014-06-18 | 2018-06-19 | Thetis Pharmaceuticals Llc | Mineral amino-acid complexes of active agents |
| US9242008B2 (en) | 2014-06-18 | 2016-01-26 | Thetis Pharmaceuticals Llc | Mineral amino-acid complexes of fatty acids |
| US10512611B2 (en) | 2015-02-23 | 2019-12-24 | Omthera Pharmaceuticals Inc. | Millicapsule formulations comprising polyunsaturated free fatty acids |
| WO2016178066A1 (en) * | 2015-05-01 | 2016-11-10 | Mohan M Alapati | Compositions and methods for the treatment of hyperglycemia and metabolic syndrome |
| US10130719B2 (en) | 2016-06-03 | 2018-11-20 | Thetis Pharmaceuticals Llc | Compositions and methods relating to salts of specialized pro-resolving mediators |
| US11135298B2 (en) | 2016-06-03 | 2021-10-05 | Thetis Pharmaceuticals Llc | Compositions and methods relating to salts of specialized pro-resolving mediators |
| US11191840B2 (en) | 2016-06-03 | 2021-12-07 | Thetis Pharmaceuticals Llc | Compositions and methods relating to salts of specialized pro-resolving mediators |
| US11925688B2 (en) | 2016-06-03 | 2024-03-12 | Thetis Pharmaceuticals Llc | Compositions and methods relating to salts of specialized pro-resolving mediators |
| WO2018015175A1 (en) | 2016-07-08 | 2018-01-25 | Astrazeneca Ab | Pharmaceutical compositions |
| US11872201B2 (en) | 2018-06-21 | 2024-01-16 | Nuseed Nutritional Us Inc. | DHA enriched polyunsaturated fatty acid compositions |
Also Published As
Similar Documents
| Publication | Publication Date | Title |
|---|---|---|
| US20190029985A1 (en) | Dpa-enriched compositions of omega-3 polyunsaturated fatty acids in free acid form | |
| US8507466B2 (en) | Oils enriched with diacylglycerols and phytosterol esters and unit dosage forms thereof for use in therapy | |
| JP6469261B2 (en) | Millicule formulation containing polyunsaturated free fatty acids | |
| AU2013201793B2 (en) | DPA-enriched compositions of omega-3 polyunsaturated fatty acids in free acid form | |
| AU2015203404A1 (en) | DPA-enriched compositions of omega-3 polyunsaturated fatty acids in free acid form | |
| JP2005325072A (en) | Adiponectin decrease inhibitor | |
| US20230146568A1 (en) | Formulations with lipid systems carrying bioactive compounds for use as an immunotherapy potentiator or adjuvant for patients with cancer or immunological disorders | |
| JP2010241832A (en) | Adiponectin decrease inhibitor | |
| JP2016500055A (en) | Method for reducing triglycerides | |
| JP2005225863A (en) | Lipase inhibitor |
Legal Events
| Date | Code | Title | Description |
|---|---|---|---|
| WWE | Wipo information: entry into national phase |
Ref document number: 2013201793 Country of ref document: AU |
|
| 121 | Ep: the epo has been informed by wipo that ep was designated in this application |
Ref document number: 13733671 Country of ref document: EP Kind code of ref document: A1 |
|
| WWE | Wipo information: entry into national phase |
Ref document number: 2013733671 Country of ref document: EP |
|
| ENP | Entry into the national phase |
Ref document number: 2860512 Country of ref document: CA |
|
| WWE | Wipo information: entry into national phase |
Ref document number: 233517 Country of ref document: IL |
|
| ENP | Entry into the national phase |
Ref document number: 2014551376 Country of ref document: JP Kind code of ref document: A |
|
| WWE | Wipo information: entry into national phase |
Ref document number: 12014501553 Country of ref document: PH Ref document number: MX/A/2014/008309 Country of ref document: MX |
|
| NENP | Non-entry into the national phase |
Ref country code: DE |
|
| WWE | Wipo information: entry into national phase |
Ref document number: 001081-2014 Country of ref document: PE |
|
| WWE | Wipo information: entry into national phase |
Ref document number: CR2014-000350 Country of ref document: CR |
|
| ENP | Entry into the national phase |
Ref document number: 20147021557 Country of ref document: KR Kind code of ref document: A |
|
| WWE | Wipo information: entry into national phase |
Ref document number: NC2018/0002420 Country of ref document: CO Ref document number: A201407804 Country of ref document: UA Ref document number: 14170543 Country of ref document: CO |
|
| ENP | Entry into the national phase |
Ref document number: 2014128500 Country of ref document: RU Kind code of ref document: A |
|
| REG | Reference to national code |
Ref country code: BR Ref legal event code: B01A Ref document number: 112014016788 Country of ref document: BR |
|
| WWE | Wipo information: entry into national phase |
Ref document number: 12015502307 Country of ref document: PH |
|
| ENP | Entry into the national phase |
Ref document number: 112014016788 Country of ref document: BR Kind code of ref document: A2 Effective date: 20140707 |